 Inverity
The Carbon Cost of Images: What the Models Actually Say
Date Published

If you ran your homepage through a carbon calculator in June 2025 and again in August 2025, your site's estimated footprint fell by roughly two-thirds. You changed nothing. The model did. That single fact should reshape how you read every "your website emits X grams of CO2" claim, because a number you cannot check is not a measurement. It is a press release.
This piece takes the sustainable web models seriously enough to show you their internals, their critics, and the one conclusion that survives contact with both.
TL;DR
- The Sustainable Web Design Model v4 estimates 0.194 kWh per GB transferred (operational), plus 0.106 kWh/GB embodied (Sustainable Web Design Model v4, 2025).
- Website Carbon's July 2025 update to v4 cut its CO2e estimates by roughly two-thirds overnight (Wholegrain Digital, 2025).
- Published kWh/GB figures span two orders of magnitude, from ~0.01 to legacy values of 3.9-7 (Ismael Velasco, 2023-25). The variance is methodological, not empirical noise.
- Images remain the largest byte category on the median page: 1,058 KB desktop, roughly 37% of total weight (Web Almanac 2025, 2025).
- Optimization wins under every model on the table. The disagreement is about how much, not whether.
How much CO2 does loading an image page actually emit?
Under the current Sustainable Web Design Model (v4), the median 2.86 MB desktop page produces roughly 0.27 g CO2e operational per uncached view, about 0.42 g including embodied emissions. That figure is derived, not measured: 0.00286 GB x 0.194 kWh/GB x 494 gCO2e/kWh, using the model's own published coefficients (SWDM v4, 2025).
We label that calculation "derived" deliberately. Nobody metered your visitor's phone, their cell tower, or the data center rack. The model multiplies bytes by an average energy intensity (0.194 kWh/GB, split across data centers at 0.055, networks at 0.059, and end-user devices at 0.080) and then by an average grid intensity of 494 gCO2e/kWh from Ember's global dataset.
Here's the uncomfortable part. Run the same page through the previous model version, v3 at 0.81 kWh/GB, and you get a number roughly three times higher. The model version changes the answer more than most real-world optimizations do. Any vendor quoting your "image carbon footprint" to two decimal places without naming the model version is selling confidence they don't have.
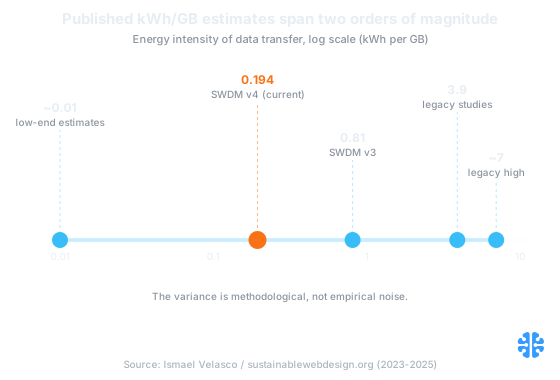
Published kWh/GB estimates span two orders of magnitude, and the variance is methodological, not empirical (Ismael Velasco, 2023-25; SWDM v4, 2025).
Why did Website Carbon's numbers drop two-thirds in July 2025?
Because the underlying model changed, not the internet. On July 14, 2025, Website Carbon adopted SWDM v4, and Wholegrain Digital reported the update cut CO2e estimates by roughly two-thirds versus v3, noting "the internet appears to be operating more efficiently than previously thought" (Wholegrain Digital, 2025).
That honesty deserves credit. Wholegrain published the change, explained it, and took the reputational hit of telling clients their previous reports were 3x too high. Compare that with how most optimization vendors handle a methodology revision: quietly, or never.
The v4 revision also restructured what gets counted. It now separates operational energy (0.194 kWh/GB) from embodied energy (0.106 kWh/GB): the manufacturing cost of servers, routers, and above all consumer devices. Embodied device energy is the single largest embodied line item at 0.081 of that 0.106 kWh/GB (SWDM v4, 2025). Keep that number in mind. It becomes the model's best defense in the next section.
If a two-thirds swing between versions sounds disqualifying, consider the alternative reading: this is what a model correcting itself in public looks like. The disqualifying behavior would be freezing v3 because the bigger numbers made better marketing.
Is page weight even a valid proxy for emissions?
The strongest critique says mostly no, at the margin. DebugBear declines to publish per-page carbon numbers at all, arguing that page weight is a poor predictor of marginal emissions because network infrastructure draws near-constant power whether or not your bytes travel through it (DebugBear, 2024-25).
This is the attributional-versus-consequential accounting split, and it's genuinely unresolved. Attributional models like SWDM divide total internet energy by total traffic and assign you your share. Consequential models ask what actually changes when you ship 500 KB less, and the answer for the network segment is close to nothing, tonight, on infrastructure that's already powered on.
The SWDM's maintainers don't dodge this. The v4 documentation concedes the model "will overestimate actual emissions" by design (SWDM v4, 2025). Their defense is the device-turnover argument: bytes are a workable proxy for the demand curve. Heavier pages push users toward newer, more powerful devices sooner, and embodied device manufacturing is the largest embodied cost in the model. Traffic growth is also what justifies building the next data center. The IEA puts data-centre electricity at roughly 415 TWh in 2024, around 485 TWh in 2025, and projects roughly 950 TWh by 2030 (IEA, Energy and AI, 2025-26). Nobody builds that capacity for traffic that isn't coming.
Both camps are right about different questions. DebugBear is right that tonight's marginal gram is near zero. SWDM is right that the aggregate trend is what provisions hardware. A calculator that hides this dispute behind a single confident number has made an editorial choice, not a scientific one.
The models agree on one thing: images
Every model on the table, attributional or consequential, points at the same lever first: images are the largest byte category on the web. The median desktop page ships 1,058 KB of images, roughly 37% of its 2,862 KB total; mobile ships 911 KB, about 36% (Web Almanac 2025, 2025).
The trend line makes it worse. The median mobile home page has grown 202.8% since 2015, and mobile page weight rose another 8.4% year over year (Web Almanac 2025, 2025). At the 90th percentile, pages ship 6.8 MB of images alone. Whatever your accounting philosophy, that is the demand curve the SWDM says provisions hardware, and it is climbing.
The headroom is equally concrete. AVIF still accounts for only around 1% of image requests (HTTP Archive Web Almanac, 2024), which means the single largest byte category on the web is still overwhelmingly delivered in formats a decade or more old. We've argued elsewhere that file size alone is the wrong metric for quality decisions, and that holds here too: the goal isn't minimum bytes, it's minimum bytes at verified perceptual quality. But the direction of travel is not in dispute under any model.
SWDM v4 segment | kWh/GB | Share of operational | What green hosting fixes |
|---|---|---|---|
Data centers | 0.055 | ~28% | Yes |
Networks | 0.059 | ~30% | No |
End-user devices | 0.080 | ~41% | No |
Operational total | 0.194 | 100% | ~28% at best |
Embodied (all segments) | 0.106 | separate | No (0.081 is device manufacturing) |
Source: Sustainable Web Design Model v4, 2025.
That table also settles the green-hosting question. Verified green hosting shifts only the data-center segment, 0.055 of 0.194 kWh/GB, leaving roughly 70% of operational energy untouched, plus effectively all embodied device cost. It's necessary, not sufficient. Adoption is real but partial: 45% of active .eco websites used verified green hosting as of September 2025, across 95 green hosts (.eco annual review, 2025).
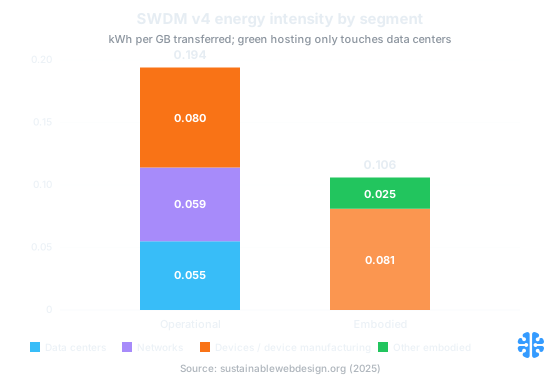
SWDM v4 energy intensity by segment: green hosting reaches only the 0.055 kWh/GB data-center slice (Sustainable Web Design Model v4, 2025).
Will the W3C Web Sustainability Guidelines make this mandatory?
Not yet, but the structure is built for it. The W3C's Web Sustainability Guidelines reached Draft Note status on December 15, 2025, with 92 guidelines and 254 success criteria, and a W3C Statement was targeted for Earth Day, April 22, 2026 (W3C Sustainable Web IG, 2025).
The design choice worth noticing: WSG deliberately mirrors WCAG's architecture. Guidelines, success criteria, machine-readable JSON. WCAG followed a predictable path from voluntary guidance to procurement checkbox to, in many jurisdictions, legal requirement. WSG is shaped to travel the same road. Teams that treat media efficiency as an audit-ready discipline now, with the same rigor they apply to Core Web Vitals and image weight, will find that transition boring. That's the goal.
FAQ
How much CO2 does a website image actually produce per view?
Under SWDM v4, a derived estimate for the median 2.86 MB page is ~0.27 g CO2e operational per uncached view, ~0.42 g with embodied emissions (SWDM v4, 2025). Images are ~37% of those bytes. Treat any per-image figure as a model output, not a measurement.
Is the Website Carbon Calculator accurate? Why did its numbers drop in 2025?
It's a model, and models get revised. On July 14, 2025 it adopted SWDM v4, cutting estimates roughly two-thirds versus v3 (Wholegrain Digital, 2025). Published kWh/GB values span two orders of magnitude across studies, so always cite the model version alongside the number.
Does switching to AVIF or WebP really reduce my carbon footprint, or just my bytes?
Directly, it reduces bytes; whether bytes equal emissions is the attributional-versus-consequential dispute. But images are the largest byte category (~37% of median page weight, Web Almanac 2025), and byte reduction improves the case under every published model, plus speed and cost immediately.
What are the W3C Web Sustainability Guidelines, and are they mandatory?
A W3C Draft Note (December 15, 2025) with 92 guidelines and 254 success criteria, structured like WCAG with machine-readable success criteria (W3C, 2025). They are not mandatory. Their WCAG-like architecture makes future adoption as a procurement requirement plausible, which is reason enough to audit against them early.
Is green hosting enough to make my media delivery sustainable?
No. Green hosting addresses only the data-center segment: 0.055 of the 0.194 kWh/GB operational total, under 30% (SWDM v4, 2025). Networks and end-user devices, plus embodied device manufacturing, sit outside your host's control. Adoption is also partial: 45% of active .eco sites used verified green hosting in September 2025 (.eco).
The conclusion that survives every model
Strip away the contested coefficients and three facts remain. Images are the largest byte category on the median page and growing. Data-centre electricity demand is projected to roughly double from 2025 to 2030 (IEA, 2025-26). And the cheapest gram of any kind, carbon, bandwidth cost, or user attention, is the byte you never ship.
So optimize, but be honest about why. Don't publish a carbon badge computed from a model you can't name, and be suspicious of anyone who does. This is how we think about it at Inverity: the same verifiability standard we apply to compression claims applies to sustainability claims, which is why our approach to perceptual media optimization reports measurable quality and byte deltas rather than derived carbon grams. Reduce the bytes at verified quality. Let the models argue over how much credit you get.