 Inverity
E-commerce Product Image Optimization: A Conversion Playbook
Date Published
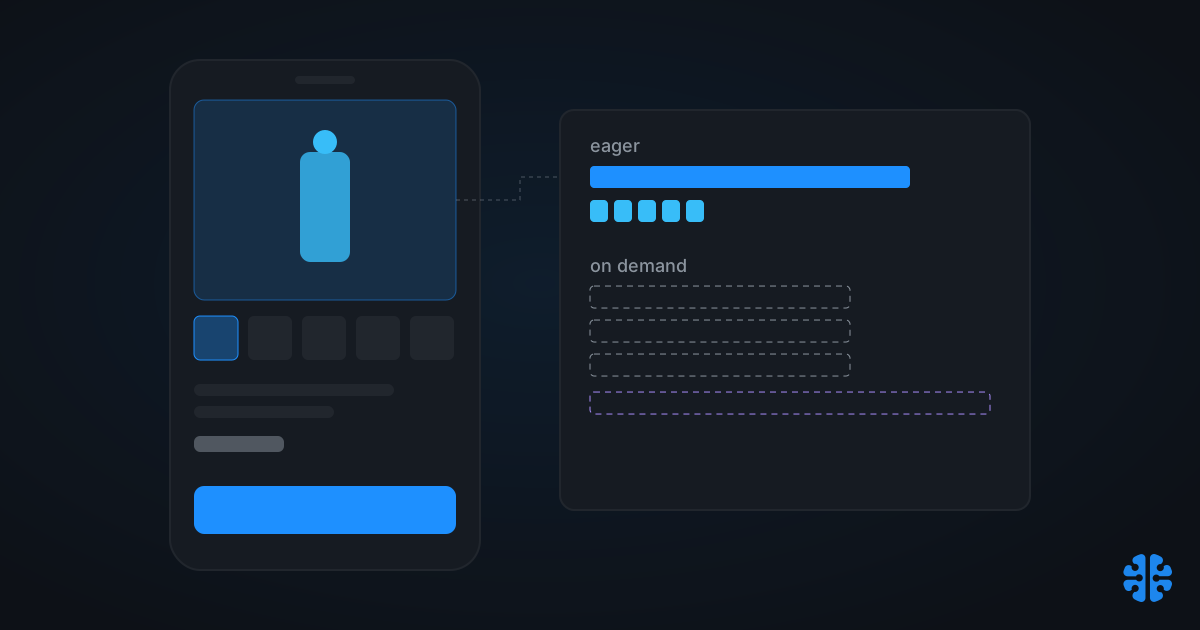
TL;DR >- 56% of shoppers' first action on a product page is exploring the images (Baymard Institute), yet images are also the single largest share of page weight: 911 KB of a 2,559 KB median mobile page (Web Almanac 2025).- 63% of visitors bounce from pages taking over 4 seconds, per an analysis of 500M+ visits across 1,300+ e-commerce sites (Yottaa Web Performance Index, 2025, via Queue-it).- Shoppers expect roughly 5-8 images per product (Salsify, 2025). UX research demands more pixels; performance demands fewer bytes. That's the zoom paradox.- The resolution: per-image byte budgets by gallery position. Spend on the hero, defer the gallery, load zoom variants on demand. Budget table below.
The product image advice you'll find on most e-commerce blogs contradicts itself, and almost nobody admits it. The UX literature says: more images, higher resolution, deeper zoom. The performance literature says: fewer bytes, faster paint, smaller payloads. Both are right, both cite real research, and following either one blindly costs you conversions from the other side.
The way out isn't a compromise where you ship medium-quality everything. It's an allocation problem. A product gallery is not one image decision; it's eight or more decisions with different jobs, different load timings, and different byte budgets. This playbook connects the UX requirements to the performance budget math, position by position.
Why do product images decide whether shoppers convert?
Because images are the first thing shoppers evaluate and the heaviest thing you ship. 56% of visitors' first action on a product page is exploring the images (Baymard Institute), and images account for roughly 36% of median mobile page weight: 911 KB of 2,559 KB (Web Almanac 2025, Page Weight).
That pairing defines the whole problem. The asset class that most influences the purchase decision is also the biggest single lever on load time. And the trend is going the wrong way: the median home page grew about 7.8% year over year to 2.7 MB, up 202.8% on mobile since 2015 (Web Almanac 2025, Page Weight).
Mobile makes the stakes concrete. Mobile devices carry about 59% of global e-commerce sales, roughly $2.51 trillion in 2025, and 44.6% of US e-commerce (Statista, 2025). Your gallery budget is therefore set by a mid-range phone on a 4G connection, not by the fiber-connected desktop where your team reviews the designs.
How much does slow actually cost?
More than most teams budget for. The freshest large-scale number: 63% of visitors bounce from pages taking over 4 seconds, from an analysis of 500M+ visits across 1,300+ e-commerce sites (Yottaa Web Performance Index, 2025, via Queue-it). Speed is a revenue input, not an engineering vanity metric.
The canonical studies behind the "speed = money" consensus are older, and their age should be stated rather than hidden. The most-cited retail figure comes from a 2020 Deloitte/Google study, "Milliseconds Make Millions": a 0.1-second improvement in mobile site speed lifted retail conversions by 8.4% and average order value by 9.2% (Deloitte, 2020). Six years old now, but still the best controlled retail dataset on marginal speed gains.
Older still, and still the industry's bounce benchmark: Google/SOASTA research from 2016-2017 found 53% of mobile visits abandoned when load exceeded 3 seconds, with bounce probability rising 32% as load time went from 1 to 3 seconds (Think with Google, 2016-2017). A decade of hardware improvement hasn't repealed the underlying behavior, and the 2025 Yottaa data lands in the same territory. Patience hasn't improved; pages have gotten heavier.
The honest summary: precise coefficients vary by study and vintage, but every credible dataset from 2016 through 2025 points the same direction, and images are the largest controllable share of the payload.
What is the zoom paradox?
The zoom paradox is the direct conflict between UX research and performance budgets. Baymard finds shoppers need high-resolution, zoomable imagery, and that roughly 25% of e-commerce sites provide insufficient resolution or zoom (Baymard Institute). Meanwhile shoppers expect roughly 5-8 images per product (Salsify, 2025), and every extra high-res image inflates a payload that already drives bounces.
Do the naive math and the conflict is obvious. Eight gallery images at full 2048x2048 resolution, delivered upfront, would blow past the entire 911 KB median image budget several times over. But shipping eight small, non-zoomable images fails the 56% of shoppers who came to inspect the product, and puts you in the 25% of sites Baymard flags for insufficient zoom.
The resolution is timing, not compromise. High resolution and small initial payload only conflict if every pixel ships at page load. It doesn't have to:
- Load eagerly: one hero image, sized to the viewport, plus tiny thumbnails.
- Load on interaction: gallery images 2 through 8, fetched when the shopper swipes or clicks.
- Load on demand: the full-resolution zoom variant, fetched only when the shopper actually zooms, ideally tiled so you fetch the region under the cursor rather than the whole asset.
The shopper who zooms gets every pixel Baymard says they need. The shopper who bounces in three seconds was never made to pay for pixels they'd never see.
Per-image byte budgets by gallery position
Budgets only work per position, because each gallery position has a different job. The consensus spec from Shopify and Cloudinary guidance: 2048x2048 source images, 1:1 aspect ratio, responsive srcset, and under 100-200 KB delivered per gallery image in WebP or AVIF, with zoom served as an on-demand high-res variant rather than upfront.
Here is that consensus turned into a working budget table. The source spec and the eager-total logic are grounded in the numbers above; the per-position splits are our recommended allocations, not published statistics:
Gallery position | Job | When it loads | Delivered budget (recommendation) |
|---|---|---|---|
Hero image (likely your LCP) | First paint, first impression | Eagerly, high priority | 100-200 KB, viewport-sized via |
Thumbnail strip (5-8 thumbs) | Navigation, signal gallery depth | Eagerly | ~5-15 KB each |
Gallery images 2-8 | Product inspection | On swipe/click | Under 100-200 KB each, never upfront |
Zoom variant | Detail verification | On zoom gesture only | Uncapped resolution; excluded from initial load |
360°/spin sequence | Optional engagement | On explicit tap | Never upfront; it's dozens of frames |
The test of the table: eager load comes to roughly 150-300 KB of imagery, well inside the 911 KB median image weight (Web Almanac 2025, Page Weight), while the full gallery experience still offers 2048px zoom on every image. UX requirement met, performance budget met, no compromise made. The trick was never compression alone; it was refusing to spend bytes before the shopper asks for them.
Two implementation notes. First, the hero image is almost certainly your Largest Contentful Paint element, so it deserves the full priority treatment covered in our Core Web Vitals playbook for image-heavy sites: eager loading, high fetch priority, correct sizes. Second, resist applying one compression setting across all positions. A thumbnail tolerates aggressive compression; a zoom variant exists precisely to survive scrutiny. This is the per-asset reasoning we've argued for in why blanket compression hurts your CMS.
Which format should product images use?
WebP as the negotiated default, AVIF where your pipeline can pre-generate it, JPEG as the fallback. WebP delivers files roughly 25-35% smaller than JPEG, and AVIF typically 50% smaller than JPEG and 20-30% smaller than WebP at comparable visual quality (Cloudinary codec research).
For product catalogs specifically, AVIF's main drawback matters less than usual. Its encode cost is high, but product images are stable assets: encode once at ingest, serve millions of times. Pre-generating an AVIF variant per rendition is a one-time cost with a compounding payoff, unlike on-the-fly transformation where AVIF's CPU bill recurs on every cache miss.
One warning that applies doubly to product photography: compression ratios are averages, and product images are where compression artifacts cost actual revenue. Fabric texture, metal finish, label legibility: these are the details shoppers zoom in to verify, and the details aggressive encoding destroys first. Byte savings that misrepresent the product convert into returns. Quality gates for product imagery should be perceptual, not just numeric, for the reasons covered in PSNR vs SSIM vs "looks good to humans".
The 360° question
The evidence for 360° product photography is weaker than its marketing suggests, so treat it as a test candidate rather than a proven tactic. Reported case studies associate 360° views with conversion lifts of roughly 30-47% and 15-25% fewer returns (Scaleflex roundup, mixed vintage), but these figures come from vendor-adjacent case reporting of mixed age, not controlled independent studies. We could not verify them against primary sources, and you should weight them accordingly.
The honest position: 360° plausibly helps for products where physical inspection drives purchase confidence (furniture, footwear, hardware), and the returns-reduction mechanism is at least logically sound. If you test it, the performance rule is absolute: a spin viewer is dozens of frames and must load only on an explicit tap, per the budget table above. A 360° sequence that loads eagerly is the fastest way to lose the 63% of visitors who won't wait past 4 seconds (Yottaa, 2025) in pursuit of an unverified lift.
Run it as an A/B test on your own traffic, on a category where inspection matters, with the on-demand loading pattern. Then you'll have the one dataset that actually settles the question for your store.
Where this leaves your gallery
The playbook in one pass: budget by position, not by page. Spend 100-200 KB on a priority-loaded hero, pennies on thumbnails, nothing upfront on the rest. Serve WebP/AVIF with a JPEG fallback. Keep 2048px zoom variants on demand so Baymard's 56% of image-first shoppers get their inspection without taxing everyone else's load time.
At Inverity, this per-position, per-asset allocation is exactly the kind of decision we think media pipelines should make automatically and verifiably: measure what each image needs to do its job, spend that, and prove the quality held. But the framework above is vendor-neutral. Any team with a CDN and an image pipeline can implement it this quarter, and the median 911 KB of image weight says most teams should.
FAQ
What image size should product photos be for e-commerce?
Consensus guidance from Shopify and Cloudinary: 2048x2048 pixel source files at 1:1 aspect ratio, delivered responsively via srcset at under 100-200 KB per gallery image in WebP or AVIF. Keep full resolution for the on-demand zoom variant; never ship 2048px files as the default gallery rendition.
Do more product images increase conversion rates?
Shoppers expect roughly 5-8 images per product listing (Salsify, 2025), and 56% explore images as their first action on a product page (Baymard Institute). More angles help, but only when loaded on interaction so gallery depth doesn't slow the initial paint.
How does page speed affect e-commerce conversion rates?
Materially. 63% of visitors bounce from pages taking over 4 seconds (Yottaa, 2025), and Deloitte's 2020 retail research found a 0.1s mobile speed improvement lifted conversions 8.4% and order value 9.2% (Deloitte, 2020). Images, at ~36% of page weight, are the biggest lever.
Should product images be WebP or JPEG?
WebP, served via content negotiation with a JPEG fallback. WebP runs roughly 25-35% smaller than JPEG at comparable quality, and AVIF roughly 50% smaller than JPEG (Cloudinary codec research). For stable product catalogs, pre-generate AVIF at ingest; the one-time encode cost amortizes across every subsequent view.
Does 360-degree product photography actually increase sales?
Unproven but plausible. Reported case studies claim conversion lifts around 30-47% and 15-25% fewer returns (Scaleflex roundup, mixed vintage), but these are vendor-adjacent figures we could not verify against primary sources. Treat 360° as an A/B test candidate, loaded strictly on demand, not as a guaranteed win.