 Inverity
Butteraugli vs SSIMULACRA2: Metrics That Judge Pixels
Date Published
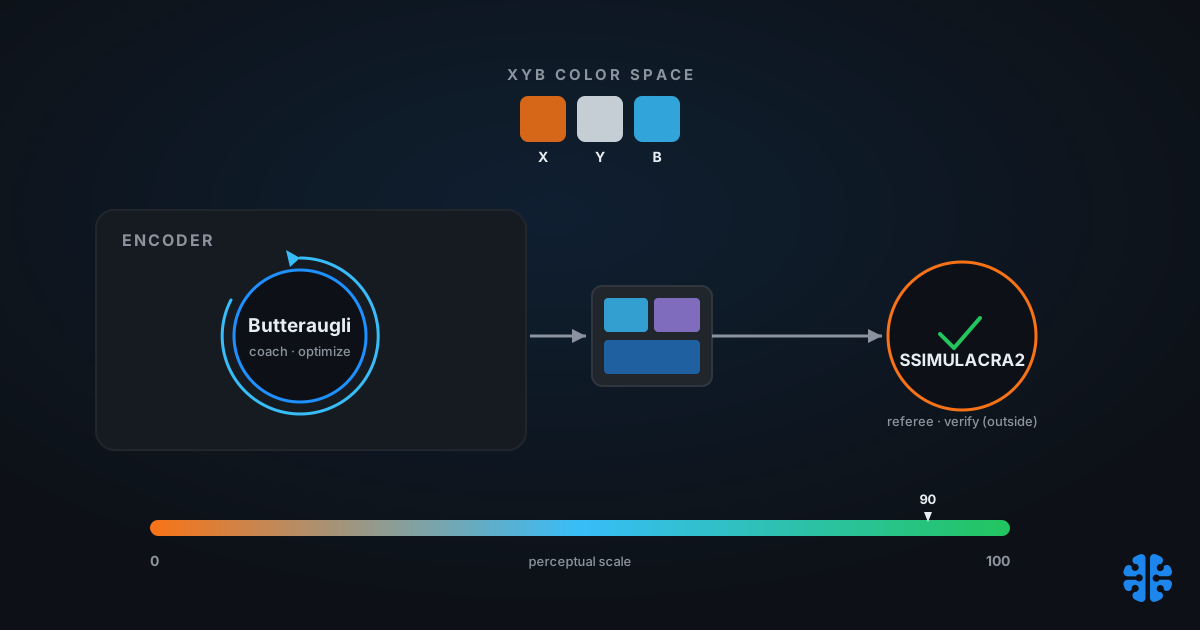
TL;DR >- Butteraugli is an optimization-time metric that lives inside the encoder; SSIMULACRA2 is an evaluation-time metric that acts as a third-party verifier. Same job, opposite sides of the fence (Butteraugli README, Google).- Both descend from the XYB color space, built to mimic the eye's edge detection and opponent-color processing because PSNR "wasn't enough" (Journey to JPEG XL, Google OSS Blog, 2026).- The original SSIMULACRA agreed with human preference 87% of the time, versus 82% for DSSIM, 80% for Butteraugli, and 67% for PSNR (Cloudinary, 2017).- SSIMULACRA2's interpretation scale runs from 10 (bad) to 90 (visually lossless) to 100 (mathematically lossless), which turns a float into a pipeline decision (SSIMULACRA2 README, Cloudinary).
Most teams treat "perceptual metric" as one undifferentiated category, and that is the mistake. Butteraugli and SSIMULACRA2 are both perceptual, both born at Google-adjacent labs, both built on the same color science. But they do different jobs at different moments. One steers the encoder while it works. The other grades the encoder after it finishes. Confuse the two and you either optimize against your own referee or ship without one.
This post separates them cleanly. We cover why encoders abandoned PSNR and SSIM, the shared XYB lineage that connects both metrics, how to read a SSIMULACRA2 score as an actual threshold, and where both metrics still break down. For the wider map, start with our complete guide to image compression. Here the subject is narrower: who optimizes, who verifies, and what the numbers mean.
What is the difference between Butteraugli and SSIMULACRA2?
Butteraugli runs inside the encoder as an optimization target; SSIMULACRA2 runs outside it as an independent verifier. Butteraugli "estimates the psychovisual similarity of two images" and is most reliable "in the domain of barely noticeable differences," outputting both a scalar score and a spatial difference map (Butteraugli README, Google). SSIMULACRA2 grades the finished file.
The timing is the whole distinction. Butteraugli is optimization-time: Guetzli and later encoders call it in a loop to decide which quantization choices to keep, chasing a target Butteraugli distance. SSIMULACRA2 is evaluation-time: you run it after encoding, ideally with a different metric than the one the encoder optimized, so the score is not marking its own homework.
Using the same metric to both optimize and verify is a hidden failure mode almost nobody names. If your encoder minimizes Butteraugli and you then "verify" with Butteraugli, you have measured how well the optimizer hit its own target, not whether the image looks good. That is why a separate evaluation-time metric matters: SSIMULACRA2 is the referee precisely because it was not the coach. The distinction between a fidelity number and a perceptual verdict runs through fidelity vs perceptual efficiency.
Citation capsule: Butteraugli is an optimization-time metric that steers an encoder toward a target psychovisual distance, reliable "in the domain of barely noticeable differences" (Butteraugli README, Google). SSIMULACRA2 is an evaluation-time verifier scored after encoding, which is why it should differ from the metric the encoder optimized.
Why don't encoders just optimize PSNR or SSIM?
Because PSNR measures pixel-wise error and SSIM approximates structure at a single scale, and both miss defects the eye catches in color-rich images. XYB and Butteraugli were built specifically to mimic the human visual system's edge detection and opponent-color processing after PSNR "wasn't enough" and SSIM-like metrics "failed in color-rich environments" (Journey to JPEG XL, Google OSS Blog, 2026).
PSNR is mean squared error dressed up in decibels. It has no model of vision at all, so it rewards pixel accuracy the eye does not care about and ignores structured artifacts the eye hates. SSIM was a real advance, adding a structural comparison, but its single-scale approximation misses edge and texture loss that becomes obvious in saturated color. Optimize either one hard enough and you get files that score well and look wrong.
The deeper reason connects to how vision itself is organized. Your eye does not compute per-pixel differences; it detects edges and processes color as red-green and blue-yellow opponent channels. A metric that ignores that structure optimizes for the wrong thing. We trace the full pixel-versus-perception argument in PSNR vs SSIM vs looks-good-to-humans, and it is the reason both metrics here start from a vision-shaped color space rather than raw RGB.
The shared XYB lineage nobody points out
Butteraugli and SSIMULACRA2 are not cousins; they share a spine. Both operate in the XYB color space, an opponent-color representation that originated in Butteraugli and was later adopted as the internal representation of Pik, jpegli, and lossy JPEG XL (JPEG XL system paper, arXiv 2506.05987). The metric's color science became the codec's color science.
That lineage is why the two metrics tend to agree in the ranges that matter. XYB models opponent-color processing so that a unit of distance in the space corresponds roughly to a unit of perceived difference, which is exactly what you want a quality metric to measure. SSIMULACRA2 builds on multi-scale SSIM but computes it in XYB, then adds two asymmetric error maps, one for blockiness and ringing, one for smoothing and blur, across six scales from 1:1 to 1:32, aggregating 108 maps with a mix of 1-norm and 4-norm (SSIMULACRA2 README, Cloudinary).
The asymmetry in those error maps is the underappreciated detail. Blur and blockiness are not the same defect to a human, so treating them symmetrically, the way a naive metric would, throws away information the eye uses. SSIMULACRA2 scores over-smoothing and ringing on separate maps because one reads as softness and the other as noise. That asymmetry is the same insight that makes Butteraugli's diff map useful: where the error is matters as much as how much.
The practical payoff of the shared origin showed up early. Guetzli used Butteraugli to pick quantization tables and produced JPEGs "20-30% smaller" by Google's blog framing, or "29 to 45% reduction for a given Butteraugli distance" by the Guetzli paper's own numbers (Google OSS Blog / arXiv 1703.04421, 2017). Cite both figures with care: they differ by source and by what they hold constant, and the gap itself is a lesson in reading compression claims.
Reading a SSIMULACRA2 score as a threshold
Read a SSIMULACRA2 result as a labeled scale, not a raw float. SSIMULACRA2 ranges from negative infinity to 100, where 10 is bad, 30 poor, 50 fair, 70 high, 80 imperceptible side-by-side, 85 imperceptible in-place, 90 visually lossless, and 100 mathematically lossless (SSIMULACRA2 README, Cloudinary). Those labels are what turn a number into a decision.
The anchors carry precise meanings worth internalizing. At 80, an artifact is imperceptible when two images sit side by side. At 85, it is imperceptible even when one flickers in place of the other, a stricter test. At 90, the file is visually lossless in normal viewing. Only 100 means every pixel is bit-exact. The gap between 85 and 90 is small in float terms and large in what it promises.
Score | Label | Practical meaning |
|---|---|---|
100 | Mathematically lossless | Bit-exact, no distortion |
90 | Visually lossless | No visible difference in normal viewing |
85 | Imperceptible in-place | Survives a flicker test at 1:1 |
80 | Imperceptible side-by-side | No difference when compared directly |
70 | High | Artifacts perceptible but not annoying |
50 | Fair | Artifacts clearly visible |
30 | Poor | Degraded |
10 | Bad | MOS near 1 |
Scale: SSIMULACRA2 README, Cloudinary.
Scores can go negative, and that is not a bug. Because the top of the scale is anchored at 100 for a perfect match, badly mangled images fall below zero, which simply means "worse than the poorest labeled anchor." In a pipeline you rarely care about the exact negative value; you care that it is far below your threshold and the encode should be rejected outright.
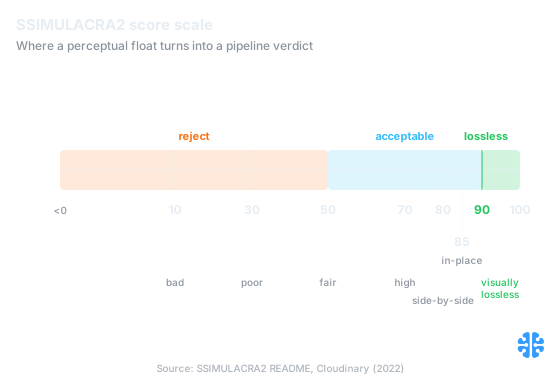
The SSIMULACRA2 scale turns a perceptual float into a ship-or-reject verdict (SSIMULACRA2 README, Cloudinary).
How well do these metrics actually agree with humans?
Well enough to trust as a gate, not well enough to trust blindly near lossless. The original SSIMULACRA (2017) agreed with human preference 87% of the time, ahead of DSSIM at 82%, Butteraugli at 80%, and PSNR at 67%, across 682 clear-preference pairs drawn from over 4,000 crowdsourced comparisons (Cloudinary, 2017). On high-confidence pairs those figures rose to 98%, 91%, 91%, and 78%.
The current metric is stronger and better validated. SSIMULACRA2 v2.1, evaluated on CID22 with 4,292 subjective scores, reached a Kendall rank correlation of 0.7077, a Spearman rank correlation of 0.8904, and a Pearson correlation of 0.8787, with weights tuned across CID22, TID2013, KADID-10k, and KonFiG-IQA via Nelder-Mead optimization (SSIMULACRA2 README, Cloudinary). A Spearman near 0.89 is a metric you can build a gate on.
Metric | Agreement with humans | High-confidence pairs |
|---|---|---|
SSIMULACRA (2017) | 87% | 98% |
DSSIM | 82% | 91% |
Butteraugli | 80% | 91% |
PSNR | 67% | 78% |
Agreement figures: Cloudinary, 2017, 682 clear-preference pairs.
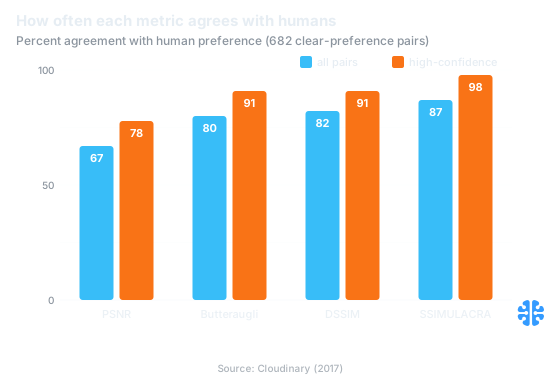
SSIMULACRA agreed with human preference 87% of the time, versus 67% for PSNR (Cloudinary, 2017).
Citation capsule: In a 2017 crowdsourced study of 682 clear-preference image pairs, SSIMULACRA agreed with human choice 87% of the time, compared with 82% for DSSIM, 80% for Butteraugli, and 67% for PSNR (Cloudinary, 2017). PSNR, the industry default, agreed least often.
Turning scores into build-pipeline thresholds
The point of a metric is a decision, so pick thresholds and act on them. A defensible CDN or build-time policy uses SSIMULACRA2 90 as the visually-lossless gate for hero and product imagery, 80 as the acceptable-efficiency floor for general content, and anything below a chosen minimum as an automatic reject that triggers a re-encode. The metric replaces the quality slider as the contract.
Here is the shape of a working policy. Encode each image, score it with SSIMULACRA2, and branch on the result: at or above 90, accept and ship; between 80 and 90, accept for non-critical content or re-encode hotter for critical content; below 80, re-encode; far below, reject and log. Because SSIMULACRA2 is roughly format-independent, one target can govern JPEG, WebP, and AVIF in the same pipeline, which is what makes cross-format comparison honest rather than apples-to-oranges.
The teams that get real value here separate the optimizer from the verifier on purpose. They let the encoder optimize Butteraugli internally, then gate on SSIMULACRA2 externally, so the number that decides "ship it" is never the number the encoder was trying to game. When those two collapse into one metric, quality regressions hide inside the optimization target and nobody sees them until a customer does. This is also why a fixed quality integer is the wrong contract, the whole argument of why a quality of 95 means nothing.
The threshold you pick should also respect just-noticeable-difference theory, because "visually lossless" is a perceptual claim with a measurable meaning. The mapping from these scores to JND-based targets, and to per-image quality control, is the subject of just-noticeable difference in image quality and of content-adaptive per-image quality.
Where do these metrics still fail?
At the very top of the scale, near lossless, where the differences shrink below one JND. A 2025 evaluation of 27 objective metrics for high-fidelity compression found that ColorVideoVDP led with a Spearman of 0.842 and Pearson of 0.958, while SSIMULACRA2, Butteraugli, and HDR-VDP-3 all degraded in the 0-to-1 JND near-lossless range (arXiv 2509.13150, 2025). Every metric gets less reliable exactly where "is this truly lossless" gets decided.
This matters for anyone chasing visually-lossless output. If your target sits at SSIMULACRA2 90 or above, you are operating in the region where the metric's own confidence is weakest, so a single score is a weaker guarantee there than at 80. The practical response is not to abandon the metric but to widen your margin near lossless, or to cross-check with a second metric, since the failure modes of SSIMULACRA2 and a VDP-family metric are not identical.
Rhetorical question worth sitting with: if the best metric still wobbles in the last JND, what does a raw quality slider tell you there? Nothing. That is the case for measuring instead of guessing, and for treating any single number near lossless as a signal to verify harder, not to relax. The scale-up version of this problem, running perceptual verification across millions of assets, is covered in measuring quality the way humans see it and measure true image quality at scale.
At Inverity we lean on exactly this optimizer-verifier split: encoders may optimize whatever internal target they like, but the shipped decision is gated on an independent, version-pinned perceptual score and recorded, so a quality claim can be re-checked rather than trusted. A claim that cannot be re-checked is not a measurement. It is a hope with a number attached.
FAQ
What is the difference between Butteraugli and SSIMULACRA2?
Butteraugli is an optimization-time metric that runs inside encoders like Guetzli to steer quantization toward a target psychovisual distance (Butteraugli README, Google). SSIMULACRA2 is an evaluation-time metric that grades a finished file from outside. Use Butteraugli to optimize and SSIMULACRA2 to verify, never the same metric for both.
Is SSIMULACRA2 90 actually visually lossless?
By its own scale, yes: 90 is labeled visually lossless, meaning no visible difference in normal viewing, while 85 is imperceptible in a flicker test and 100 is mathematically lossless (SSIMULACRA2 README, Cloudinary). But a 2025 study found all metrics weaken in the 0-1 JND range, so widen your margin near lossless (arXiv 2509.13150, 2025).
Why don't encoders just optimize PSNR or SSIM?
PSNR is pixel-wise error with no vision model, and SSIM approximates structure at a single scale, so both miss color and texture artifacts the eye catches (Journey to JPEG XL, Google OSS Blog, 2026). In a 2017 study PSNR agreed with humans only 67% of the time, versus 87% for SSIMULACRA (Cloudinary, 2017).
What color space do these metrics use, and why XYB?
Both use XYB, an opponent-color space that originated in Butteraugli and was later adopted as the internal representation of Pik, jpegli, and lossy JPEG XL (arXiv 2506.05987). XYB models the eye's edge detection and red-green, blue-yellow opponent processing, so distance in the space tracks perceived difference better than raw RGB.
Can SSIMULACRA2 scores be negative, and what does that mean?
Yes. The scale is anchored at 100 for a perfect match, so badly degraded images fall below the labeled 10-bad anchor and can go negative (SSIMULACRA2 README, Cloudinary). In practice a negative score means the encode is far worse than any acceptable threshold and should be rejected and re-encoded, not shipped.