 Inverity
How JPEG Compression Works: DCT, Quantization, Bytes
Date Published
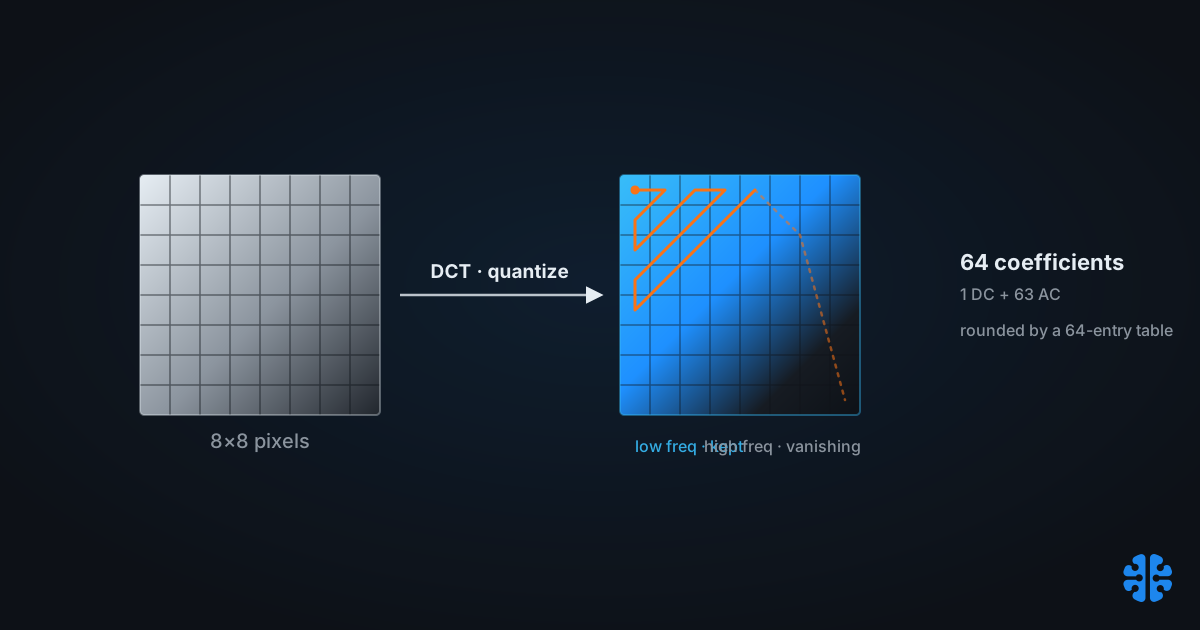
TL;DR >- JPEG still accounted for 32.3% of all web images in 2024, down from roughly 40% in 2022, so the format most people call obsolete is still the majority of the web's pictures (Web Almanac 2024, Media).- The lossy step is one operation: each of the 64 DCT coefficients in an 8x8 block is divided by a quantization-table entry and rounded to the nearest integer (ITU-T Rec. T.81, 1992).- Quantization error is the main source of loss, not the DCT itself, which is mathematically reversible (arXiv 1912.10789, 2019).- Two signature defects trace to two mechanisms: blocking comes from quantizing 8x8 blocks independently, ringing comes from discarding high-frequency coefficients near edges (University of North Dakota, 2019; ScienceDirect).
Most JPEG explainers stop at "it uses the DCT and throws away detail your eye won't miss." That sentence is true and almost useless. It never tells you which detail, decided by which number, producing which specific smear on the screen. The interesting part of JPEG is a chain you can follow end to end: a single value in a 64-entry table sets how hard one frequency gets rounded, and that rounding is exactly what you see when a logo edge rings or a gradient breaks into blocks.
This post walks that chain. We will go pixels to bytes in pipeline order, then run it backwards: pick one quant-table number, watch which coefficient it destroys, and name the artifact that shows up. For the wider format landscape, see our complete guide to image compression. Here we stay inside one 8x8 block.
What does JPEG actually throw away?
JPEG discards frequencies, not pixels. It transforms each block into 64 frequency coefficients, then rounds the high-frequency ones toward zero. Quantization error from that rounding is "the main source of lossy compression," while the transform itself is reversible (arXiv 1912.10789, 2019). Nothing is deleted spatially. Detail is coarsened in frequency space.
That distinction explains almost everything downstream. Your eye is far more sensitive to some frequencies than others, so JPEG keeps the coefficients you notice and crushes the ones you don't. The psychovisual model behind those decisions is a separate topic, but the mechanism it drives lives entirely in one table of 64 numbers.
Why does that matter to anyone shipping images? Because every quality slider, every "optimize" button, and every visible artifact is that table being scaled up or down. Once you can read the table, the rest of JPEG stops being a black box.
The JPEG pipeline, in order
JPEG runs a fixed sequence of stages, and the order matters because each stage assumes the previous one. The canonical baseline pipeline is: color convert to Y'CbCr, optionally subsample chroma, split into 8x8 blocks, level-shift, forward DCT, quantize, reorder by zigzag, then entropy-code (ITU-T Rec. T.81, 1992). Only two of those stages actually lose information.
Here is the full sequence with the job each stage does.
Stage | Operation | Lossy? |
|---|---|---|
Color transform | RGB to Y'CbCr, separating luma from two chroma channels | No (rounding aside) |
Chroma subsampling | Optionally halve chroma resolution, often 4:2:0 | Yes, if enabled |
Blocking | Partition each channel into 8x8 blocks | No |
Level shift | Subtract 128 to center samples around zero | No |
Forward DCT | Convert 64 pixels to 64 frequency coefficients | No (reversible) |
Quantization | Divide each coefficient by a table entry, round | Yes, primary loss |
Zigzag | Reorder coefficients low to high frequency | No |
Entropy coding | Huffman or arithmetic coding of the stream | No, lossless |
Two stages in that table are lossy: chroma subsampling, which we cover in chroma subsampling explained, and quantization. Everything else is either exactly reversible or a lossless repacking. Baseline JPEG uses 8-bit precision per sample and Huffman entropy coding by default, with arithmetic coding available as an option (ISO/IEC 10918-1 notes). The final entropy stage, covered in entropy coding explained, squeezes the quantized numbers without touching image quality at all.
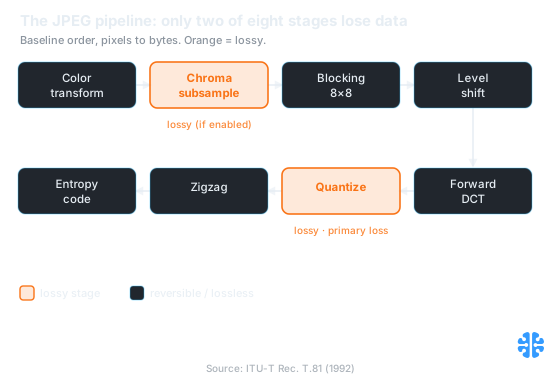
The baseline JPEG pipeline in order; only chroma subsampling and quantization lose information (ITU-T Rec. T.81, 1992).
What does the quality slider actually change?
The quality slider scales the quantization table, nothing more. In the reference IJG implementation, a quality value maps to a scale factor, then every base table entry is rescaled by (base * scale + 50) / 100 and floored at 1. Quality 50 uses the standard table unchanged; quality 100 drives every entry to 1, which is near-lossless (fastcompression / IJG).
The mechanics are worth stating precisely. For quality below 50, the scale factor is 5000 / q; for quality 50 and above, it is 200 - 2q (fastcompression / IJG). Lower quality means larger table entries, which means coefficients get divided by bigger numbers and more of them round to zero. That is the entire trick. There is no separate "detail" knob. When you drag quality from 90 to 60, you are multiplying all 64 divisors up, and the coefficients living near the bottom-right of the block, the high frequencies, are the first to vanish.
This is why file size and quality trade off so sharply near the middle of the range. Push the table entries up and long runs of zero coefficients appear, which the entropy coder packs almost for free. The physics of that redundancy is what makes the savings so lopsided.
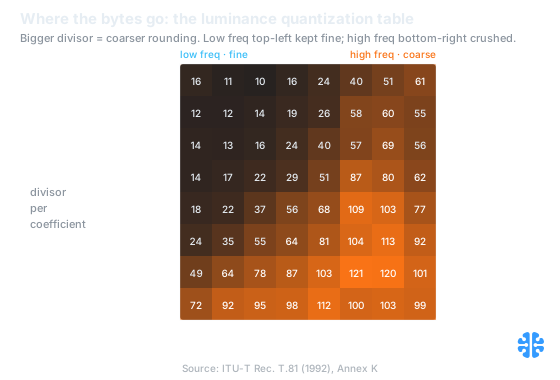
The standard luminance quantization table: small divisors preserve low frequencies top-left, large divisors crush high frequencies bottom-right (ITU-T Rec. T.81, 1992, Annex K).
From one quant-table number to one visible defect
Here is the throughline no quality slider tells you: each table entry controls exactly one frequency, and killing that frequency produces a predictable artifact. The table weights low frequencies finely and high frequencies coarsely, so the bytes concentrate where your eye looks and the loss concentrates where it (usually) doesn't (ITU-T Rec. T.81, 1992). Follow one number and you can predict the smear.
Start with the coefficient layout. Each 8x8 block produces 64 coefficients: one DC term at position (0,0) that holds the block's average brightness, and 63 AC terms of increasing spatial frequency (ITU-T Rec. T.81, 1992). The DC coefficient is coded differentially against the previous block's DC, a DPCM step, because neighboring blocks usually share similar average brightness. The AC coefficients are read in the zigzag order that sweeps from top-left to bottom-right, clustering the low-frequency non-zeros first and grouping the trailing zeros so run-length coding can collapse them (EmergentMind).
Now pick a number. Raise the top-left, low-frequency table entries and you coarsen the block averages themselves. Because those averages are quantized per block and the blocks are 8x8 and non-overlapping, adjacent blocks snap to slightly different levels, and the boundary between them becomes visible. That is blocking, and it comes precisely from quantizing independent 8x8 blocks, appearing at medium-to-high compression (University of North Dakota, 2019).
Raise the bottom-right, high-frequency entries instead and you zero out the coefficients that reconstruct sharp edges. A hard edge needs many high-frequency terms to stay crisp; remove them and the reconstruction overshoots and oscillates around the edge, a Gibbs-phenomenon effect. That is ringing, the halo of shimmer you see around black text on a white background (ScienceDirect).
So the two most recognizable JPEG failures are not vague "compression noise." Blocking is the low-frequency table entries doing their job too hard. Ringing is the high-frequency entries doing theirs. One table, two directions, two named defects.
Table region | Coefficient killed | Artifact | Where you see it |
|---|---|---|---|
Top-left (low freq) | Block average, DC and near-DC | Blocking | Smooth gradients, skies, flat color |
Bottom-right (high freq) | Sharp-edge detail | Ringing | Text edges, logos, hard contours |
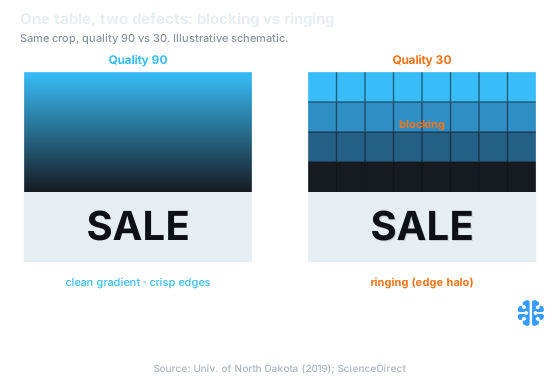
Illustrative schematic: low-frequency quantization produces blocking in gradients, high-frequency quantization produces ringing around edges (University of North Dakota, 2019; ScienceDirect).
Why is JPEG great for photos but bad for text?
Photos are mostly low-frequency content, which JPEG preserves; text is mostly high-frequency edges, which JPEG discards first. The quantization table protects the low frequencies your eye favors and coarsens the high frequencies it usually ignores (ITU-T Rec. T.81, 1992). Photographs win; line art loses.
Think about what a photograph is made of. Skin, sky, foliage, and blur are dominated by gradual changes, which live in the low-frequency coefficients JPEG keeps at high fidelity. The occasional sharp detail is masked by surrounding texture, so the ringing hides. A screenshot or a chart is the opposite: crisp black-on-white edges, thin lines, and flat fills, all of which depend on the exact high-frequency coefficients JPEG throws away, against flat backgrounds where the ringing has nowhere to hide.
This is also why the honest quality question is never "what quality factor should I use?" but "what is this image made of?" A photographic hero and a UI screenshot need different treatment, which is why blanket settings quietly wreck half a library. We have argued that blanket compression hurts your CMS for exactly this reason. For synthetic content, a lossless format usually beats any JPEG quality factor.
Does re-saving a JPEG make it worse every time?
Mostly yes, because each save re-runs the lossy quantization on already-quantized data. Re-encoding a decoded JPEG applies the divide-and-round step again, and unless the pipeline is bit-identical, coefficients drift further toward zero on each pass (ITU-T Rec. T.81, 1992). This accumulation is generation loss.
The nuance is that the damage is not uniform. If you re-save at the same quality with the same quantization table, an aligned pipeline can be nearly idempotent, because the already-quantized coefficients often survive a second rounding to the same values. But change the quality, crop off the 8x8 grid, or switch encoders, and the block boundaries and table entries no longer align, so fresh error compounds. Editing workflows that open, tweak, and re-save repeatedly are the classic way images degrade with no single obvious culprit. We go deeper on recompression and generation loss in its own post.
FAQ
Does JPEG throw away pixels or frequencies?
Frequencies. JPEG converts each 8x8 block into 64 DCT coefficients, then rounds the high-frequency ones toward zero during quantization (ITU-T Rec. T.81, 1992). No pixel is deleted directly. The visible result is coarser detail, because that rounding is "the main source of lossy compression" (arXiv 1912.10789, 2019).
What does the JPEG quality slider actually do?
It scales the quantization table. In the IJG reference, quality 50 uses the standard table, and quality 100 sets every entry to 1 for near-lossless output (fastcompression / IJG). Lower quality multiplies the divisors up, so more coefficients round to zero and the file shrinks.
Why do JPEG artifacts appear in an 8x8 grid?
Because JPEG quantizes each 8x8 block independently, with no overlap between blocks (University of North Dakota, 2019). When compression is heavy, neighboring blocks round their averages to slightly different levels, and the seams between them become visible. That grid pattern is called blocking.
What causes the halo around text in a JPEG?
Ringing. Sharp edges need high-frequency DCT coefficients to stay crisp, and coarse quantization removes them, causing a Gibbs-phenomenon overshoot that oscillates around the edge (ScienceDirect). It is most visible on hard contours against flat backgrounds, like black text on white.
Is JPEG obsolete in 2026?
Not by usage. JPEG was 32.3% of all web images in 2024, down from about 40% in 2022, still the single largest share (Web Almanac 2024, Media). Newer formats compress better, but JPEG's ubiquity, tooling, and reversible-transcode paths keep it central to real pipelines.
The one number that runs the whole format
If you remember one thing about JPEG, make it this: the format is a 64-number table and a rounding rule. The quality slider scales the table, the table decides which frequencies survive, and the surviving frequencies decide whether you see a clean gradient or a ringing edge. Everything else, the color transform, the zigzag, the Huffman stream, is reversible bookkeeping around that single lossy step.
That is also why measuring JPEG quality by file size alone misleads. Two files at the same size can quantize very different frequencies and look nothing alike, which is the core argument in why file size is the wrong metric and in the broader debate over PSNR vs SSIM vs looks-good-to-humans. At Inverity, we treat the quantization table as the actual unit of a compression decision, because it is the layer where perceived quality is won or lost. Read the table, and you can predict the picture.