 Inverity
The Compression A/B Test That Actually Measures Perception
Date Published
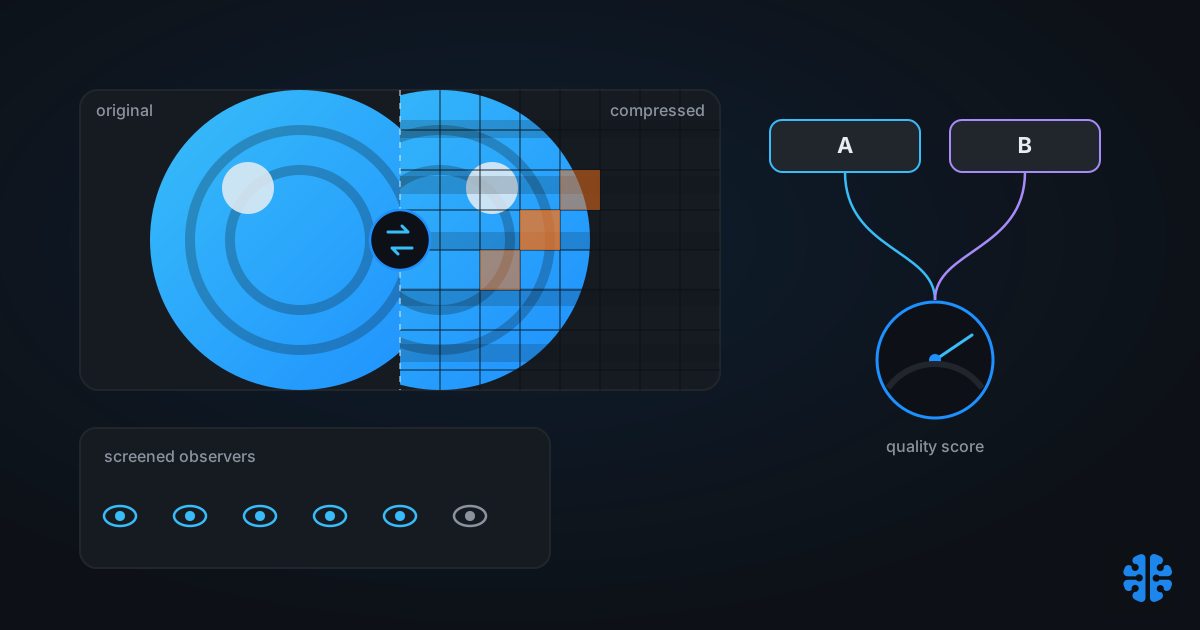
TL;DR >- ITU-R BT.500 recommends at least 15 observers for a formal subjective test, and anything fewer must be labeled "informal" (Rec. ITU-R BT.500-15, 2023).- A 2AFC (paired-comparison) design reduces required sample size and cuts fatigue and memory effects, because each image gets judged many times pairwise (PMC4742614).- SSIMULACRA2 maps to human MOS on a readable scale: 70 is "good," 85+ is "excellent," 100 is mathematically lossless (ssimulacra2 README, 2023).- A/B testing tools can add 100 to 1500 ms of load and degrade Core Web Vitals by an estimated 10 to 30% (directional), so the instrument corrupts the metric unless you net it out with an RUM holdback.
Most "compression A/B tests" measure the wrong thing, and they measure it with the wrong instrument. The usual setup ships a smaller image, watches a conversion dashboard, and declares victory or defeat. Neither half of that is sound. Nobody looked at the image, so perception was never tested, and the A/B tool itself slowed the page, so the conversion signal is contaminated by the very act of measuring. You end up with a confident number that answers no question you actually asked.
A real test has three legs, and they are usually run separately by people who never talk. A subjective panel judges whether humans can see the difference. An objective proxy like SSIMULACRA2 or Butteraugli scores that difference at scale. A production experiment checks whether the byte savings move a business metric, net of the tooling overhead. Below is the end-to-end recipe that joins all three, plus the traps, the sample-size math, and the reason your faster page did not convert.
What does a compression A/B test actually measure?
A compression A/B test has to answer two independent questions, and conflating them is the original sin. The subjective question is "can a human see the difference?" The production question is "does the smaller file change behavior?" These need different instruments, because a change nobody can see can still slow a page, and a page that got faster can still ship a visible artifact.
The perceptual leg leans on standardized subjective methods. ITU-R BT.500 and ITU-T P.910 define double-stimulus methods, DSCQS and DSIS, where the reference and the impaired image are shown together, and single-stimulus methods, ACR and ACR-HR, where only the impaired image is rated 1 to 5 (Rec. ITU-R BT.500-15, 2023). The choice of method decides how sensitive your test is to small, near-transparent differences.
The trap that ruins most homegrown tests is measuring conversion while pretending it measures perception. Conversion is a downstream, noisy proxy for "did the page feel fast and look right," and it moves for a hundred reasons that have nothing to do with your quantizer. If you want to know whether users can see the compression, you have to show them the image under controlled conditions, not infer it from a funnel.
Citation capsule: A valid compression A/B test separates perception from production. Standardized subjective methods (DSCQS, DSIS, ACR) formalize how humans rate impaired images, rating on a 1-to-5 scale under controlled viewing, so that a perceptual verdict does not get inferred from noisy downstream conversion data (Rec. ITU-R BT.500-15, 2023).
We treat this measurement discipline as foundational in our complete guide to image compression, and it is the same reason file size is the wrong metric to optimize alone.
How many observers make a subjective test valid?
At least 15, screened, for a formal result. ITU-R BT.500 recommends a minimum of 15 observers for a formal subjective assessment, and it is explicit that studies with fewer must be reported as "informal" rather than dressed up as definitive (Rec. ITU-R BT.500-15, 2023). Fifteen is a floor, not a target.
Raw headcount is not enough, because unscreened observers add noise that swamps the small differences you care about. BT.500 screens observers for normal or corrected-to-normal visual acuity using a Snellen or Landolt chart, and for normal color vision using an Ishihara test, before the session begins (Rec. ITU-R BT.500-15, 2023). An observer who cannot resolve the detail you are testing is not a data point. They are contamination.
The method you choose changes how many people you need. A 2AFC or paired-comparison design reduces the required sample size and reduces fatigue, carryover, and memory effects, because each image is judged many times pairwise rather than scored once in isolation, which makes it less time-consuming and more accurate than per-image confidence scoring (PMC4742614). Fewer, better-structured comparisons beat more raw ratings.
Test scenario | Minimum observers | Method | Screening |
|---|---|---|---|
Formal sign-off | 15+ | DSCQS or 2AFC | Acuity + color vision |
Near-transparent / high-fidelity | 15+ | Flip test or 2AFC | Acuity + color vision, calibrated display |
Informal internal check | 4 to 14 | 2AFC | Acuity at minimum, label results "informal" |
Single-reviewer smoke test | 1 | Flip test | Not statistically valid; catches gross errors only |
Thresholds and screening from Rec. ITU-R BT.500-15, 2023; sample-size logic of paired comparison from PMC4742614.
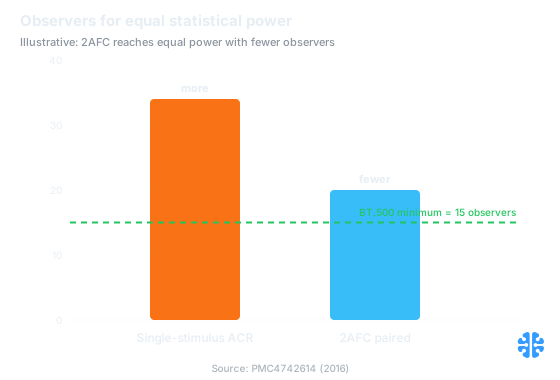
Illustrative: 2AFC paired comparison reaches equal statistical power with fewer observers than single-stimulus ACR, still above the BT.500 minimum of 15 (PMC4742614).
Viewing conditions matter as much as headcount for near-transparent work. BT.500 specifies viewing distance in picture heights (for 3840x2160, that is 1.6 to 3.2 picture heights), a display calibrated with the PLUGE pattern, and peak luminance between 70 and 500 cd/m² (Rec. ITU-R BT.500-15, 2023). Get these wrong and you either miss real artifacts or hallucinate ones that do not exist.
Flip test or side-by-side: which method fits?
Use side-by-side (2AFC) for clearly visible differences, and the flip test for near-transparent ones. When two encodes are far apart in quality, a paired comparison is efficient and reliable. When they are almost identical, side-by-side comparison fails because the eye adapts and the difference hides between the two frames. The flip test rapidly alternates the original and the compressed image in the same spot, so any difference shows up as flicker.
The flip (or flicker) test is the sensitive method for high-fidelity, near-transparent comparisons, and it is standard in AV1 and JPEG XL evaluation precisely because side-by-side viewing is not sensitive enough at that fidelity (Rec. ITU-R BT.500-15, 2023). If nothing flickers, a human cannot see the difference under those conditions, which is exactly the verdict you want at high quality.
In our own review sessions, the flip test catches things side-by-side never surfaces: a faint ringing halo on high-contrast text, a smeared patch of foliage, banding in a sky that was invisible until the two frames swapped in place. The moment of swap is where the eye is most sensitive, and it is the only reliable way we have found to judge encodes that are meant to be visually lossless.
Citation capsule: For near-transparent compression, the flip test, which rapidly alternates original and compressed images in the same location, is more sensitive than side-by-side viewing, which is why it is standard in AV1 and JPEG XL evaluation (Rec. ITU-R BT.500-15, 2023).
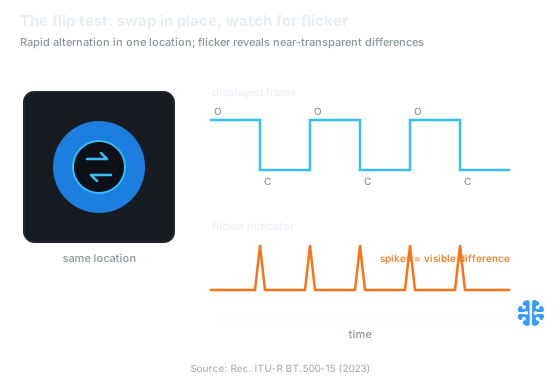
The flip test alternates original and compressed in one location, so any flicker marks a visible difference (Rec. ITU-R BT.500-15, 2023).
The perceptual thresholds behind this, why a difference becomes visible at all, are the subject of the just-noticeable-difference in image quality, and the panel methodology sits alongside how we benchmark.
Can SSIMULACRA2 and Butteraugli replace human eyes?
For screening at scale, yes; for final sign-off, no. A calibrated objective metric lets you score thousands of images without a panel, then reserve human review for the borderline cases. SSIMULACRA2 is the strong default because it maps to human mean opinion score on a readable scale, and Butteraugli specializes in the near-transparent regime where you most need sensitivity.
SSIMULACRA2 outputs a score from negative infinity to 100, and its README anchors that scale to BT.500 ACR ratings: about 10 is MOS 1 (bad), 30 is 2 (poor), 50 is 3 (fair), 70 is 4 (good), 85 and above is 5 (excellent), and 100 is mathematically lossless (ssimulacra2 README, 2023). Those anchors are what let one number stand in for a panel verdict. The metric was created by Jon Sneyers at Cloudinary, with v2.1 released through 2022 and updated in April 2023.
SSIMULACRA2 score | MOS (BT.500 ACR) | Meaning | Use in a pipeline |
|---|---|---|---|
~10 | 1 | Bad | Reject |
~30 | 2 | Poor | Reject |
~50 | 3 | Fair | Borderline, human review |
~70 | 4 | Good | Practical quality floor |
85+ | 5 | Excellent | Near-transparent, ship |
100 | Mathematically lossless | Reference |
Mapping from ssimulacra2 README, 2023.
The metric earns that mapping with real correlation. Validated on CID22 with 4,292 held-out scores, SSIMULACRA2 v2.1 reached a Spearman correlation of 0.8904, a Pearson of 0.8787, and a Kendall of 0.7077 against human opinion (ssimulacra2 README, 2023). That is strong, not perfect, which is exactly why it screens rather than signs off.
Butteraugli covers the sensitive end. It is reliable in the region of barely-noticeable differences, outputs both a scalar distance and a spatial difference map, and models the low density of blue cones in human vision through its XYB color space (butteraugli README). The spatial map is the useful part: it tells you where an artifact is, not just that one exists.
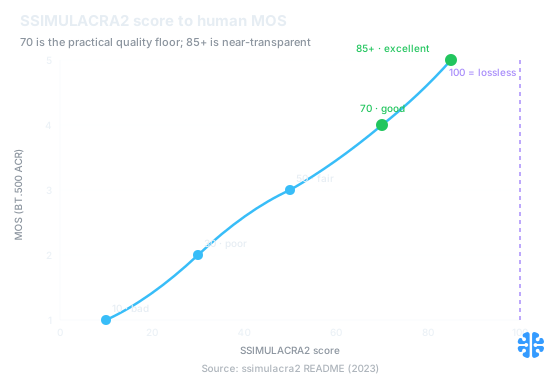
SSIMULACRA2 maps to human MOS: 70 is "good," 85+ is "excellent," and 100 is mathematically lossless (ssimulacra2 README, 2023).
That Butteraugli feedback loop is why encoders built on it compress harder at equal quality. Guetzli, which uses Butteraugli as its distance target, achieves a 29 to 45% data-size reduction at equal Butteraugli distance compared with other JPEG encoders (Guetzli, arXiv:1703.04421). The metric is not just a scorekeeper; it can drive the encode. The full metric family is dissected in Butteraugli and SSIMULACRA2 explained, and the "why humans, still" argument sits in measuring true image quality at scale.
The right division of labor: metric for the sweep, humans for the sign-off. Cloudinary's q_auto, for instance, picks per-image quality with heuristics plus a trial encode or two, then checks the result with an SSIMULACRA-derived metric across levels best, good (default), eco, and low (Cloudinary). That is the pattern: automate the screen, escalate the borderline cases to a panel.
Your A/B testing tool is corrupting Core Web Vitals
The instrument slows the page it is measuring. Client-side A/B testing tools inject a script that can add an estimated 100 to 1500 ms of load and degrade Core Web Vitals by roughly 10 to 30% (a directional, Tier-4 figure, not a precise benchmark). That overhead lands on both the control and the variant, so a genuine speedup from smaller images can be masked, or a null result can look like a regression.
This is why your "faster" page did not convert. If the compression saved 200 ms of image load but the A/B tool added 400 ms of script blocking, the variant is slower in the field even though your images got lighter. The measurement apparatus ate the win. Treating the tool as neutral is the mistake.
The fix is an RUM holdback, and almost nobody runs it. Disable the A/B tool on a fraction of traffic, then compare real-user-monitoring Core Web Vitals for that holdback against the tool-enabled traffic. The delta between them is your tooling tax. Subtract it, and only then compare variant against control on the tool-enabled slice. Without the holdback, you are measuring the tool as much as the treatment.
Citation capsule: Client-side A/B testing tools add measurable load, an estimated 100 to 1500 ms, and can degrade Core Web Vitals by roughly 10 to 30% (directional). Because that overhead hits both arms of the test, a genuine image-size win can be masked unless you net it out with an RUM holdback slice.
Pair every size metric with a perceptual guardrail so you never optimize bytes into visible harm. A practical rule is to hold SSIMULACRA2 at or above 70 ("good") while you chase file size, rather than letting the byte target run unbounded (ssimulacra2 README, 2023). The field-metrics context lives in Core Web Vitals and images.
The screenshot-recompression traps that void a test
Screenshots quietly re-encode your images, which invalidates the comparison. The single most common way people ruin a compression A/B test is by capturing screenshots of the two variants and comparing those. A screenshot is a fresh encode, so you are no longer comparing your two files. You are comparing two screenshots of them, each with its own added artifacts.
Three traps hide inside that workflow. First, capture-then-re-save adds a second generation of compression artifacts on top of whatever your pipeline produced, so generation loss contaminates both images. Second, OS and browser screenshot tools apply their own scaling and color management, silently altering pixels before you ever look. Third, uncalibrated displays and the wrong viewing distance make near-transparent differences either invisible or exaggerated, which is the exact confound BT.500's viewing-condition rules exist to remove (Rec. ITU-R BT.500-15, 2023).
The rule is simple: compare the actual encoded files, decoded losslessly, never a screenshot of them. Feed the original and the compressed file directly into your metric and your flip test. If you must show reviewers something, render both from the source files under identical, calibrated conditions. The mechanics of stacked re-encodes are covered in recompression and generation loss.
The end-to-end recipe
Run the three legs in order, and gate each on the last. First, screen at scale with SSIMULACRA2, holding a floor of 70 and flagging anything from 50 to 70 for review (ssimulacra2 README, 2023). Second, put the flagged and borderline encodes in front of at least 15 screened observers using a flip test for near-transparent cases and 2AFC for visible ones (Rec. ITU-R BT.500-15, 2023; PMC4742614).
Third, run the production conversion A/B with an RUM holdback so you can subtract the testing tool's Core Web Vitals overhead before you trust the funnel. Only a variant that clears the perceptual guardrail, survives the human panel, and shows a net field improvement after the holdback correction is a real win. Everything short of that is an advertisement, not a measurement.
This is the seam Inverity works on: making the perceptual decision measurable and reproducible, so a quality claim comes with the evidence to check it. Pinning the metric, recording the score, and keeping humans in the loop for sign-off is how a compression change stops being a hope and becomes a result. The broader argument sits in our complete guide to image compression.
FAQ
How many people do I need for a valid compression test?
At least 15 screened observers for a formal result, per ITU-R BT.500, and any test with fewer must be labeled "informal" (Rec. ITU-R BT.500-15, 2023). Screen them for visual acuity and color vision first, because an unscreened observer adds noise that hides the small differences you are trying to detect.
Can I use SSIMULACRA2 or Butteraugli instead of human reviewers?
Yes for large-scale screening, no for final sign-off. SSIMULACRA2 maps to human MOS (70 is "good," 85+ is "excellent") and correlated at Spearman 0.8904 on held-out data (ssimulacra2 README, 2023). That is strong enough to filter thousands of images, but borderline cases still need a screened human panel to sign off.
When should I use a flip test instead of side-by-side comparison?
Use the flip test for near-transparent, high-fidelity encodes, where side-by-side viewing is not sensitive enough. It rapidly alternates the original and compressed image in one spot, so any difference shows up as flicker, which is why it is standard in AV1 and JPEG XL evaluation (Rec. ITU-R BT.500-15, 2023). Reserve side-by-side for clearly visible differences.
Why did my faster page not improve conversions?
Two likely causes. Your images may already sit above the quality floor, so shrinking them further changes nothing users notice. Or your A/B testing tool added 100 to 1500 ms of load and degraded Core Web Vitals by an estimated 10 to 30% (directional), masking the real speedup. Run an RUM holdback to net out the tooling overhead.
How do I A/B test compression without the tool skewing Core Web Vitals?
Run an RUM holdback: disable the A/B tool on a fraction of traffic, then compare real-user Core Web Vitals for that slice against the tool-enabled traffic to measure the tool's overhead directly. Subtract that tax, then compare variant against control. And never compare screenshots, which re-encode your images and void the test.