 Inverity
Measuring Compression ROI: Bandwidth, Storage, Carbon
Date Published
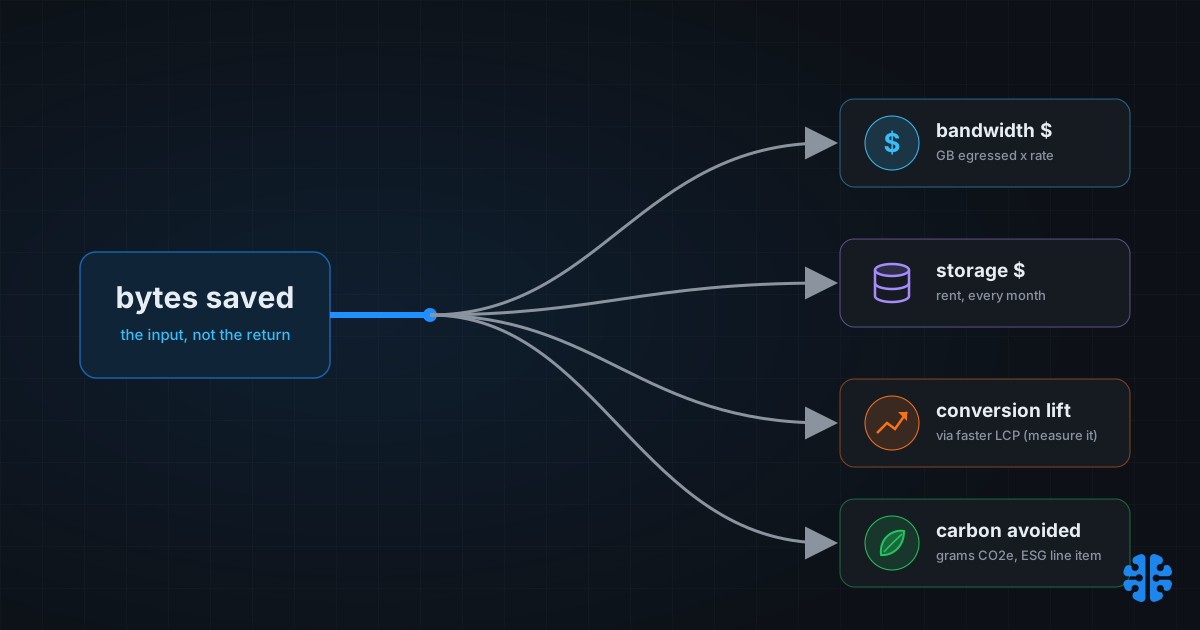
"We saved 40% of bytes" is the sentence most image-optimization projects end on. It should be the sentence they start with. Byte reduction is an input, not a return. The same 40% is worth almost nothing on one stack and thousands of dollars a month on another, depending on your egress pricing, storage footprint, traffic, and how much of your page weight was images to begin with. This piece turns that raw percentage into four measurable outputs, bandwidth dollars, storage dollars, conversion, and carbon, and works a full payback example so you can defend the project to a CFO, not just a Lighthouse score.
TL;DR
- Images are the heaviest resource on the web: a median desktop homepage ships about 1,054 KB of images versus 613 KB of JavaScript, roughly 39 to 40% of page weight (Web Almanac 2024, 2024).
- Modern formats set the byte input: AVIF runs about 50% smaller than JPEG, WebP about 25 to 35% smaller (SpeedVitals).
- Bandwidth savings depend entirely on egress pricing. AWS CloudFront lists around $0.085/GB in North America; Cloudflare R2 lists $0.00/GB egress, which shifts ROI to storage and performance (EgressCost, verify against provider pricing).
- A 0.1s mobile speed improvement moved retail conversions about 8% and travel about 10% across 37 brands (Deloitte / Think with Google, 2020). Compression is one input to that speed, not the whole cause.
- Carbon savings are calculable: GB saved times the Sustainable Web Design v4 intensities times 494 g CO2 per kWh gives grams of CO2e avoided (SWDM v4, 2025).
Why "we saved 40% of bytes" is only the input
A byte-savings percentage is an input variable, not a result, because it says nothing about how many bytes you shipped or what each byte cost you. Forty percent off a page that was mostly text is a rounding error. Forty percent off images, the single heaviest resource on the median page at roughly 1,054 KB desktop versus 613 KB of JavaScript, is a real lever (Web Almanac 2024, 2024).
Scale sets the stakes. Median total page weight in 2024 reached 2,652 KB on desktop and 2,311 KB on mobile, both up year over year, 8.6% and 6.4% respectively (Web Almanac 2024, 2024). Pages get heavier, images lead the weight, and the format you choose sets the input to every calculation below: AVIF is roughly 50% smaller than JPEG and WebP roughly 25 to 35% smaller at comparable quality (SpeedVitals).
To convert that input into a return, you multiply it through four independent channels. Two are hard dollars you can invoice, bandwidth and storage. Two are upside you should measure rather than assume, conversion and carbon. The rest of this piece takes them one at a time and then adds them up.
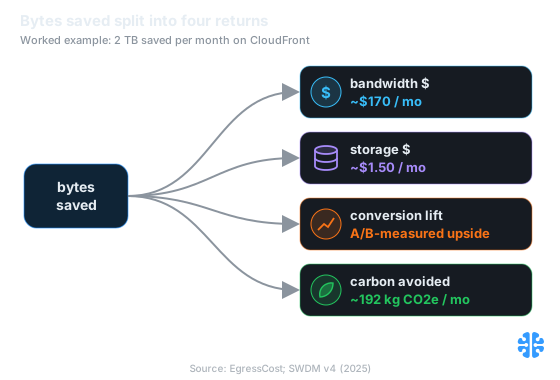
One byte-savings input becomes four returns; on 2 TB saved monthly via CloudFront that is about $170 bandwidth, $1.50 storage, A/B upside, and 192 kg CO2e. Source: EgressCost; SWDM v4 (2025).
For the format decisions that set your byte input, start with our complete guide to image compression.
How do you turn bytes saved into bandwidth dollars?
Bandwidth ROI is the most direct axis: bytes saved per image times monthly requests times your egress price per GB. The multiplier is your CDN's egress rate, and that rate varies by more than an order of magnitude between providers, which is why the same byte savings can be worth a fortune or nearly nothing.
The spread is the story. AWS CloudFront lists roughly $0.085/GB egress in North America, tiering down toward $0.020/GB at extreme volume, while Cloudflare R2 lists $0.00/GB egress at any volume (EgressCost, verify against the provider's own pricing page before you model). These are aggregator-published figures, so treat them as starting points and confirm against AWS and Cloudflare directly, because list prices change and contracts differ.
Provider | Egress list price | What compression saves here |
|---|---|---|
AWS CloudFront (North America) | ~$0.085/GB, tiering to ~$0.020/GB at volume | Direct: fewer GB egressed each month |
Cloudflare R2 | $0.00/GB egress | Nothing on egress; ROI moves to storage and speed |
Source: EgressCost (verify against provider pricing).
The zero-egress case is the instructive one. On R2, shaving bytes off delivery saves nothing on bandwidth, because bandwidth is already free. That does not make compression worthless; it relocates the return to storage cost and page speed. The lesson generalizes: always name your egress rate before you claim a bandwidth number, because the rate, not the percentage, sets the value.
For how these delivery costs sit inside the wider pipeline, see media pipeline: upload to delivery explained.
Storage rent compounds every month
Storage ROI is smaller than bandwidth but persistent, and it compounds every month you keep the files. The formula is bytes saved times your storage price per GB-month times the number of months you retain them. Where egress is a one-time charge per request, storage is rent you pay forever, so even a low rate accrues.
Concrete rate: Cloudflare R2 lists storage at $0.015/GB-month (EgressCost, verify against provider pricing). At that rate, trimming 10 GB across a media library saves $0.15 a month, or $1.80 a year, per 10 GB removed, and it keeps saving for as long as you hold the assets. For a library in the terabytes, that becomes a real line item, and it is the axis that keeps paying on zero-egress stacks.
There is a design caveat that cuts against naive storage math. The generation-loss discipline of keeping a lossless master means you deliberately store some large originals, so the storage win comes from smaller derivatives, not from throwing away masters. Optimize what you deliver, retain what you cannot regenerate. We work through that tradeoff in recompression and generation loss.
Does compression lift conversion, or just page-speed scores?
This is the axis to handle carefully, because the honest answer is: compression influences conversion indirectly, through speed, and you should measure it rather than claim it. The most-cited evidence is Deloitte's study for Think with Google, which found a 0.1-second mobile speed improvement moved retail conversions about 8% and travel about 10%, across 37 brands and 30 million sessions at a 90% confidence interval (Deloitte / Think with Google, 2020).
Read that study precisely. It measured site speed in general, not image compression specifically. The web.dev writeup of the same work reported lifts in page views and average order value alongside conversion (web.dev, 2020). Compression is one input to speed: it reduces image bytes, which improves Largest Contentful Paint, and LCP is what correlates with the conversion movement. Presenting "compression raised conversions X%" as causal overstates what the data supports.
**** The correct framing is a chain, not a claim: compression reduces image bytes, fewer bytes improve LCP, better LCP is associated with higher conversion. Each link is measurable, and the only one you should treat as directional rather than proven for your site is the last one. So model it, then run a real A/B test on your own traffic to confirm the elasticity before you bank the revenue.
A 0.1-second mobile speed improvement moved retail conversions about 8% and travel about 10% across 37 brands and 30 million sessions (Deloitte / Think with Google, 2020). The study measured site speed, not compression, so treat compression as one input to LCP and verify the conversion link with your own A/B test.
Because images are the largest byte category and the usual LCP element, they are the biggest single speed lever you control; our complete guide to image compression covers the format choices that move it.
How much carbon does compression really save?
Carbon is the fourth axis, and unlike conversion it is a direct calculation, not an inference. Multiply the GB you no longer transfer by the Sustainable Web Design Model v4 energy intensities, then by grid carbon intensity, and you get grams of CO2e avoided that you can put in an ESG report. The model gives you the coefficients.
SWDM v4, published July 14, 2025, splits operational energy into 0.055 kWh/GB for data centers, 0.059 for networks, and 0.080 for end-user devices (SWDM v4, 2025). Multiply total GB saved by those intensities and by the model's grid figure of 494 g CO2 per kWh from Ember, and the result is grams of carbon avoided (Wholegrain Digital, 2025). The same source notes v4 revised global internet energy up to 1,021 TWh against roughly 5.29 ZB of data transfer, context for why per-GB figures carry weight at scale.
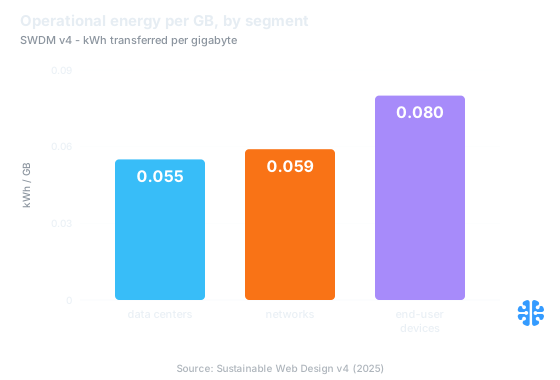
Every gigabyte you stop shipping avoids energy across all three segments. Source: Sustainable Web Design v4 (2025).
A caution worth carrying over: carbon-per-byte models are estimates that get revised, sometimes sharply, so report the model version alongside any gram figure. For the full picture of what these models claim and where critics push back, see our post on the carbon cost of images.
A worked payback example
Payback is one number: one-time project cost divided by monthly recurring savings. Bandwidth and storage are the recurring dollars; conversion and carbon sit on top as upside. Here is the arithmetic on a mid-sized library, using round figures and named rates so you can swap in your own.
Assume 500,000 images, converted from JPEG to AVIF at roughly 50% smaller (SpeedVitals), averaging 200 KB saved each. Say each image is requested 20 times a month. That is 500,000 times 200 KB times 20, about 2,000 GB, or 2 TB, of egress saved monthly.
Axis | Calculation | Monthly value |
|---|---|---|
Bandwidth (CloudFront, $0.085/GB) | 2,000 GB x $0.085 | ~$170 |
Bandwidth (R2, $0.00/GB) | 2,000 GB x $0.00 | $0 |
Storage (R2, $0.015/GB-mo) | 500,000 x 200 KB = 100 GB x $0.015 | ~$1.50 |
Conversion | LCP-driven, A/B-measured | Upside, not modeled here |
Carbon | 2,000 GB x 0.194 kWh/GB x 494 g/kWh | ~192 kg CO2e avoided |
Rates: EgressCost and EgressCost R2 (verify against provider pricing); SWDM v4 (2025).
**** Read the two columns together and the strategic point jumps out. On CloudFront, the hard-dollar recurring saving is about $171.50 a month, so a $5,000 project pays back in roughly 29 months on bandwidth and storage alone, with conversion and carbon as unbooked upside. On R2, the hard-dollar recurring saving collapses to $1.50, and the entire case rests on page speed and carbon. Same 40 to 50% byte reduction, radically different payback, decided entirely by your egress rate.
**** The mistake we see most often is a team reporting the byte percentage to leadership and stopping there. Finance cannot act on a percentage. Give them the payback month and the two upside axes, and the conversation changes from "nice engineering win" to "funded roadmap." To keep those savings from eroding as pages grow, pair the model with compression budgets that hold, and see client vs server vs build-time compression for where to run the work so it stays cheap.
FAQ
How do I calculate the dollar savings from image compression?
Multiply bytes saved per image by monthly requests to get GB saved, then by your egress rate. Add storage: bytes saved times your storage price per GB-month. Rates vary hugely, from about $0.085/GB on CloudFront to $0.00 on R2 egress (EgressCost, verify against provider pricing), so name your rate first.
Does compression increase conversions or just page-speed scores?
Indirectly, through speed. A 0.1-second improvement moved conversions 8 to 10% across 37 brands, but that study measured site speed, not compression (Deloitte / Think with Google, 2020). Compression is one input to LCP, and LCP is what tracks conversion. Model it directionally, then confirm with your own A/B test.
How much CO2 does compression really save?
Multiply GB saved by SWDM v4 intensities, 0.055 plus 0.059 plus 0.080 kWh/GB, then by 494 g CO2 per kWh (SWDM v4, 2025). Saving 2 TB of monthly transfer avoids roughly 192 kg CO2e. Report the model version, because these estimates get revised, sometimes by large margins.
What is a realistic payback period on an image-optimization project?
It depends on egress rate and volume. In our worked example, 2 TB of monthly bandwidth saved at $0.085/GB yields about $170 a month, so a $5,000 project pays back in roughly 29 months on hard dollars, with conversion and carbon as upside. On a zero-egress stack, payback rests on speed and carbon instead.
If my CDN charges zero egress like R2, is compression still worth it?
Yes, but the return relocates. With free egress, bandwidth savings vanish, so the case rests on storage rent at $0.015/GB-month (EgressCost, verify against provider pricing), faster LCP, and carbon avoided. Smaller images still load faster and emit less, which is why byte reduction pays off even when egress is free.
The percentage is the start, not the finish
A byte-savings figure is where the analysis begins. Run it through four channels and it becomes a business case: bandwidth and storage as recurring dollars you can invoice, conversion and carbon as upside you measure rather than assume. The same 40% is worth $170 a month or almost nothing, and the deciding variable is your egress rate, not your encoder.
Report the payback month, not the percentage. At Inverity we hold to a single standard across all four axes: every number should be checkable, from the egress rate you plugged in to the LCP delta you claim to the carbon model version you cited. A claim you cannot verify is marketing, not measurement. Give finance the four axes and the payback date, then keep the win with compression budgets that hold.