 Inverity
Map Tiles and Geospatial Imagery: Compression Rules
Date Published
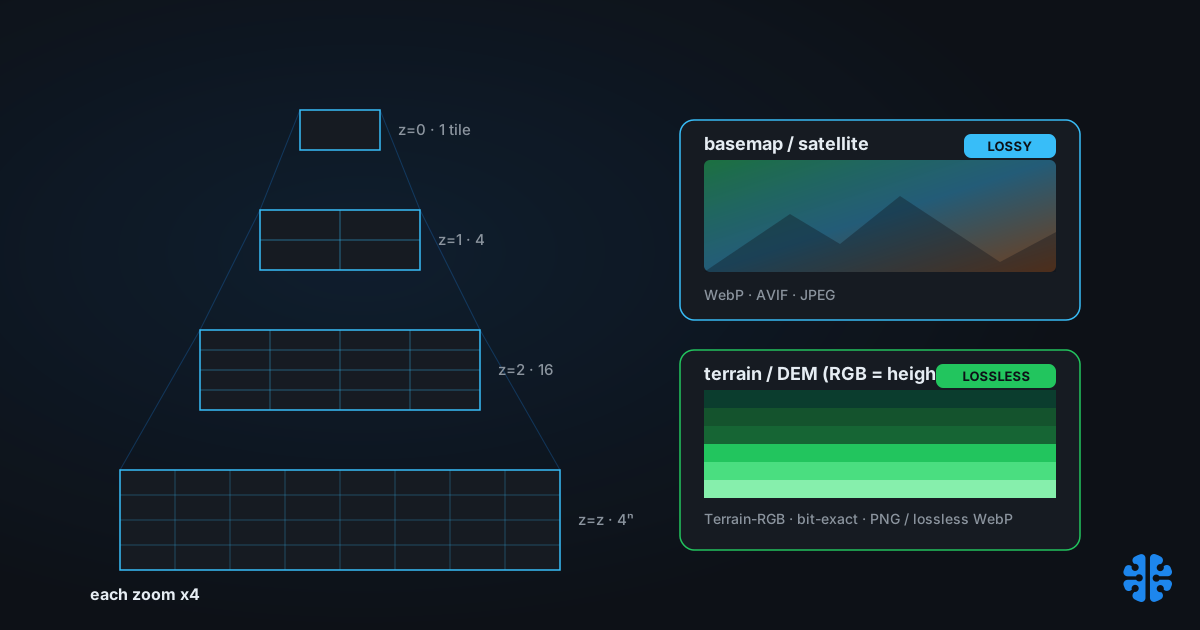
TL;DR >- Web Mercator tiles quad-divide, so total tiles equal 4^z. Zoom 20 is 1,048,576 squared, about 1.1 trillion tiles (Analyze Earth). Every extra zoom level roughly quadruples storage, which forces teams to cap max zoom or render on demand.- Format choice is data-versus-picture, not preference. Basemaps and satellite are photographic and take lossy; overlays with labels and transparency take lossless; terrain and DEM tiles must stay lossless because the RGB values are the elevation numbers (Mapbox Docs).- WebP tiles transferred about 3x less data than identical PNG tiles (Netek et al., ISPRS IJGI), and AVIF can add another 40-50% beyond WebP for raster tiles (MapLibrary).- Pre-rendered tiles and Cloud-Optimized GeoTIFF are complementary. OGC standardized COG 1.0 in July 2023, with internal tiling, overviews, and HTTP range requests (OGC 21-026).
There is a persistent myth in web mapping that choosing a tile format is a quality-versus-size preference, the same kind of slider you drag on a JPEG export. For basemaps that framing is fine. For a digital elevation model it is a correctness bug waiting to ship, because a lossy pass on a DEM does not soften the image, it invents terrain that does not exist.
Geospatial imagery breaks the usual compression intuitions in two ways. First, the storage math is exponential: tile counts grow as 4^z, so a global basemap at high zoom reaches trillions of tiles. Second, some tiles are pictures and some tiles are data wearing a picture's clothing, and the two demand opposite compression strategies. This post covers both, and it sits under our complete guide to image compression.
Why does map-tile storage explode?
Because tiles quadruple at every zoom level. Web Mercator divides each tile into four at the next level, so the total tile count is 4 raised to the zoom, or 4^z. Zoom 20 works out to 1,048,576 squared, roughly 1.1 trillion tiles for full global coverage (Analyze Earth). Each zoom level costs about four times the one below it.
The curve is brutal precisely because it is exponential. The jump from z18 to z20 is not incremental; it is another two rounds of quadrupling.
Zoom | Tiles for full coverage (4^z) | Rough magnitude |
|---|---|---|
0 | 1 | one tile, the whole world |
5 | 1,024 | thousands |
10 | 1,048,576 | ~1 million |
15 | 1,073,741,824 | ~1.07 billion |
18 | 68,719,476,736 | ~68.7 billion |
20 | 1,099,511,627,776 | ~1.1 trillion |
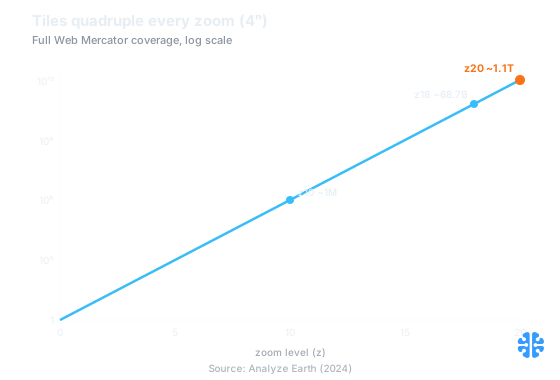
Full-coverage tile count follows 4^z: about 1 million at z10, 68.7 billion at z18, and 1.1 trillion at z20 (Source: Analyze Earth, 2024).
No one stores a full trillion-tile pyramid. The math forces three practical responses. Teams cap max zoom at the level their data actually resolves, they render high zooms on demand instead of pre-baking them, and they pack tiles into single-archive formats like PMTiles or MBTiles served with HTTP range requests, so one file replaces billions of tiny objects. The exponential curve is why "just pre-render everything" stops being an option somewhere around z16, and why the catalog-scale variant explosion we describe in e-commerce catalog compression at scale looks tame by comparison.
Citation capsule: Web Mercator tiles quad-divide, so total tiles equal 4^z: zoom 20 reaches 1,048,576 squared, about 1.1 trillion tiles (Analyze Earth). Each zoom level roughly quadruples storage, which forces mapping teams to cap maximum zoom, render high levels on demand, and pack tiles into range-served archives rather than pre-baking full pyramids.
The format-by-tile-role decision table
Choose format by what the tile contains, not by a global default. A basemap tile is a photograph and compresses well with loss. An overlay tile carries labels, lines, and transparency that loss destroys. A DEM tile is numbers encoded as color, where any loss corrupts the data. One catalog of tiles can legitimately need three different codecs at once.
Tile role | Content type | Format | Lossy or lossless | Reason |
|---|---|---|---|---|
Basemap (opaque) | Photographic or rendered map | WebP, AVIF, or JPEG | Lossy | Continuous tone; JPEG/WebP/PNG all valid per MapTiler |
Satellite / aerial | Photographic imagery | WebP or AVIF | Lossy | Highest-tonal-range photography; benefits most from lossy |
Overlay (labels, roads) | Line art plus transparency | PNG or WebP-lossless | Lossless | Hard edges and alpha break under lossy; default 8-bit PNG |
Terrain / DEM | Elevation encoded as RGB | PNG or lossless WebP | Lossless only | RGB values are the elevation numbers; loss fabricates terrain |
The role guidance is grounded in vendor docs. MapTiler routes overlay tiles with transparency to PNG or WebP and basemap tiles to JPEG, PNG, or WebP, defaulting overlays to 8-bit optimized PNG (MapTiler Docs). The split is not stylistic. It follows directly from whether a pixel's exact value carries meaning. Overlays lean on the same transparency-preservation rules as compressing transparency and alpha channels, and their sharp label edges suffer the color-edge bleeding we cover in chroma subsampling explained.
Standard tile geometry interacts with the choice. Raster tiles come in 256x256, the legacy size, and 512x512 for @2x displays, both on Web Mercator, EPSG:3857 (Azure Maps). Serving 512x512 tiles cuts request count roughly 4x versus 256x256 for the same coverage, which matters as much as per-tile bytes when you are answering millions of requests.
Why must terrain and DEM tiles stay lossless?
Because the pixels are not a picture, they are a number. Mapbox Terrain-RGB encodes elevation across the red, green, and blue channels as a base-256 value, yielding 16,777,216 distinct heights at 0.1 meter resolution, and it must be stored losslessly (Mapbox Docs). Decode that RGB triple and you get an exact elevation. Change it and you get a wrong elevation.
This is the failure the intro warned about. Lossy codecs work by discarding perceptually minor detail, quantizing neighboring values toward each other so the eye cannot tell. On a photograph that is invisible. On Terrain-RGB, "neighboring values that look identical" are elevations tens or hundreds of meters apart, because a one-step change in the blue channel is a real height difference. Lossy compression smears those values together and produces fake terraces: flat stair-steps across what should be a smooth slope.
The reason this bug ships so often is that it is invisible in every preview. A lossily-compressed Terrain-RGB tile still renders as a plausible-looking hillshade or a normal-looking gradient. Nothing in the visual output screams "corrupted". The damage only surfaces downstream, when someone computes a slope, a viewshed, a flood model, or a drone flight path from elevations that were quantized into staircases. A tile that looks fine and computes wrong is the worst kind of defect.
The same caution extends to any data-encoded raster: scientific measurements, classification masks, normalized difference indices. If a pixel's exact value is consumed as a number rather than viewed as a color, it is lossless-only. The general treatment of when loss is acceptable lives in lossless image compression formats, and the compounding damage of repeated lossy passes in recompression and generation loss.
Which format should raster photographic tiles use?
WebP is the current pragmatic sweet spot, with AVIF as the aggressive option where support allows. For photographic basemaps and satellite tiles, WebP tiles transferred about 3x less data than identical PNG tiles in a controlled study, everywhere except the initial load (Netek et al., ISPRS IJGI). That is a large, measured bandwidth win on the exact tiles that dominate map traffic.
The rule-of-thumb hierarchy extends it. WebP runs about 25-35% smaller than JPEG or PNG, and AVIF can add another 40-50% beyond WebP for raster tiles (MapLibrary). So why not default to AVIF everywhere? Support and encode cost. WebP has broad, mature support across Leaflet and MapLibre, and it carries both lossy and lossless-plus-alpha in a single format, which means one codec covers basemaps and overlays alike.
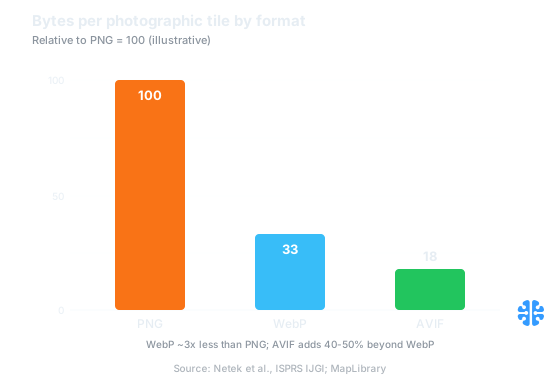
Photographic tiles by format relative to PNG: WebP transfers about 3x less, and AVIF adds another 40-50% (Source: Netek et al., ISPRS IJGI; MapLibrary).
That single-format convenience is underrated at scale. A tile server that speaks WebP can serve an opaque basemap tile lossily and an overlay tile losslessly with alpha, without switching formats or maintaining two pipelines. AVIF is the right call when your clients support it and you want the extra 40-50%, but WebP remains the safe default that covers the most roles with the least operational friction.
Pre-rendered tiles and COG are complementary, not rivals
They solve different halves of the problem, so use both. Pre-rendered tiles are fast to serve and cache beautifully, but the 4^z math caps how deep you can pre-bake. Cloud-Optimized GeoTIFF handles the other case: one big file you query directly. OGC standardized COG 1.0 in July 2023, defining internal tiling, overviews, and HTTP range requests (OGC 21-026).
The mechanism is what makes COG a complement rather than a replacement. A COG is a single GeoTIFF with an internal tile grid and pre-computed overviews at multiple resolutions. Because it supports byte-range GETs, a client fetches only the window and zoom level it needs, pulling a few kilobytes out of a multi-gigabyte file instead of downloading the whole thing. No pre-tiling step, no trillion-object bucket.
The division of labor is clean. Pre-rendered tile pyramids win for hot, global, low-to-mid zoom basemaps that everyone requests, where caching a fixed set of tiles is unbeatable. COG and dynamic tiling win for large, less-frequently-accessed rasters, satellite scenes, DEMs, scientific layers, where pre-rendering every zoom would waste storage on tiles no one views. We have seen teams treat the two as an either/or religious debate and over-build one side; the durable architectures we have watched succeed run pre-rendered tiles for the basemap and COG range-reads for the heavy analytical layers behind it.
Both patterns want the same delivery hygiene as any media system: cache aggressively, serve close to the user, and never re-touch the source on every request, the same discipline as our upload-to-delivery pipeline.
What actually cuts tile bandwidth
Two levers move the most bytes: transport compression and edge caching. Server-side GZIP cuts tile transfer by about 70%, especially for vector tiles, and CDN edge caching cuts bandwidth 40-60% (MapLibrary). Those stack on top of format choice, so they compound the WebP and AVIF savings rather than competing with them.
GZIP matters most for vector tiles, which are structured data that compresses well in transit. For already-compressed raster tiles like WebP or AVIF, transport compression adds little, so apply it where it helps and skip it where it does not. Edge caching, by contrast, helps every tile type, because the cheapest tile is the one your origin never has to generate or send twice.
At Inverity, we approach a tile pipeline the way we approach any media system: decide format by what each tile means, prove that lossless layers stayed bit-exact, and measure the bandwidth actually served rather than assuming the encoder did its job. That discipline is vendor-neutral. Whether you run MapLibre with pre-rendered WebP or COG range-reads behind a CDN, the two rules hold: match the codec to the tile's role, and never let a lossy pass touch a tile whose pixels are numbers. The sibling ingest problem for untrusted imagery lives in compressing UGC pipelines.
FAQ
Should map tiles be PNG, WebP, or AVIF?
It depends on the tile's role. Photographic basemaps and satellite tiles take lossy WebP or AVIF; WebP alone transfers about 3x less data than PNG (Netek et al., ISPRS IJGI). Overlays with transparency and terrain data need lossless PNG or lossless WebP. WebP is the safe default because it covers both cases in one format.
How many tiles do I need to store up to zoom 18 or 20?
More than you should pre-bake. Tile counts follow 4^z: zoom 18 is about 68.7 billion tiles and zoom 20 about 1.1 trillion for full coverage (Analyze Earth). Cap your maximum zoom to what your data resolves, render deep levels on demand, and pack tiles into range-served archives like PMTiles or MBTiles.
Can I use lossy compression on terrain or DEM tiles?
No. Mapbox Terrain-RGB encodes elevation as a base-256 RGB value, 16,777,216 heights at 0.1 m, and must stay lossless (Mapbox Docs). Lossy compression quantizes neighboring color values that represent real elevation differences, producing fake terraces that corrupt any slope, viewshed, or flood calculation built on the data.
What is a COG and when do I use it instead of pre-rendered tiles?
A Cloud-Optimized GeoTIFF is one GeoTIFF with internal tiling, overviews, and HTTP range support, standardized by OGC in July 2023 (OGC 21-026). Use it for large, less-frequently-accessed rasters where a client can range-fetch just the window it needs. Keep pre-rendered tiles for hot, global basemap layers.
Do basemap and overlay tiles need separate compression settings?
Yes. Basemaps are opaque and photographic, so they take lossy JPEG, WebP, or AVIF. Overlays carry labels, lines, and transparency, so they need lossless PNG or lossless WebP; MapTiler defaults overlays to 8-bit optimized PNG (MapTiler Docs). Routing them through one setting either bloats basemaps or destroys overlay edges.